29
/es/
es
AIzaSyAYiBZKx7MnpbEhh9jyipgxe19OcubqV5w
April 1, 2024
93863
Bulgaria
BGR
true
2
1
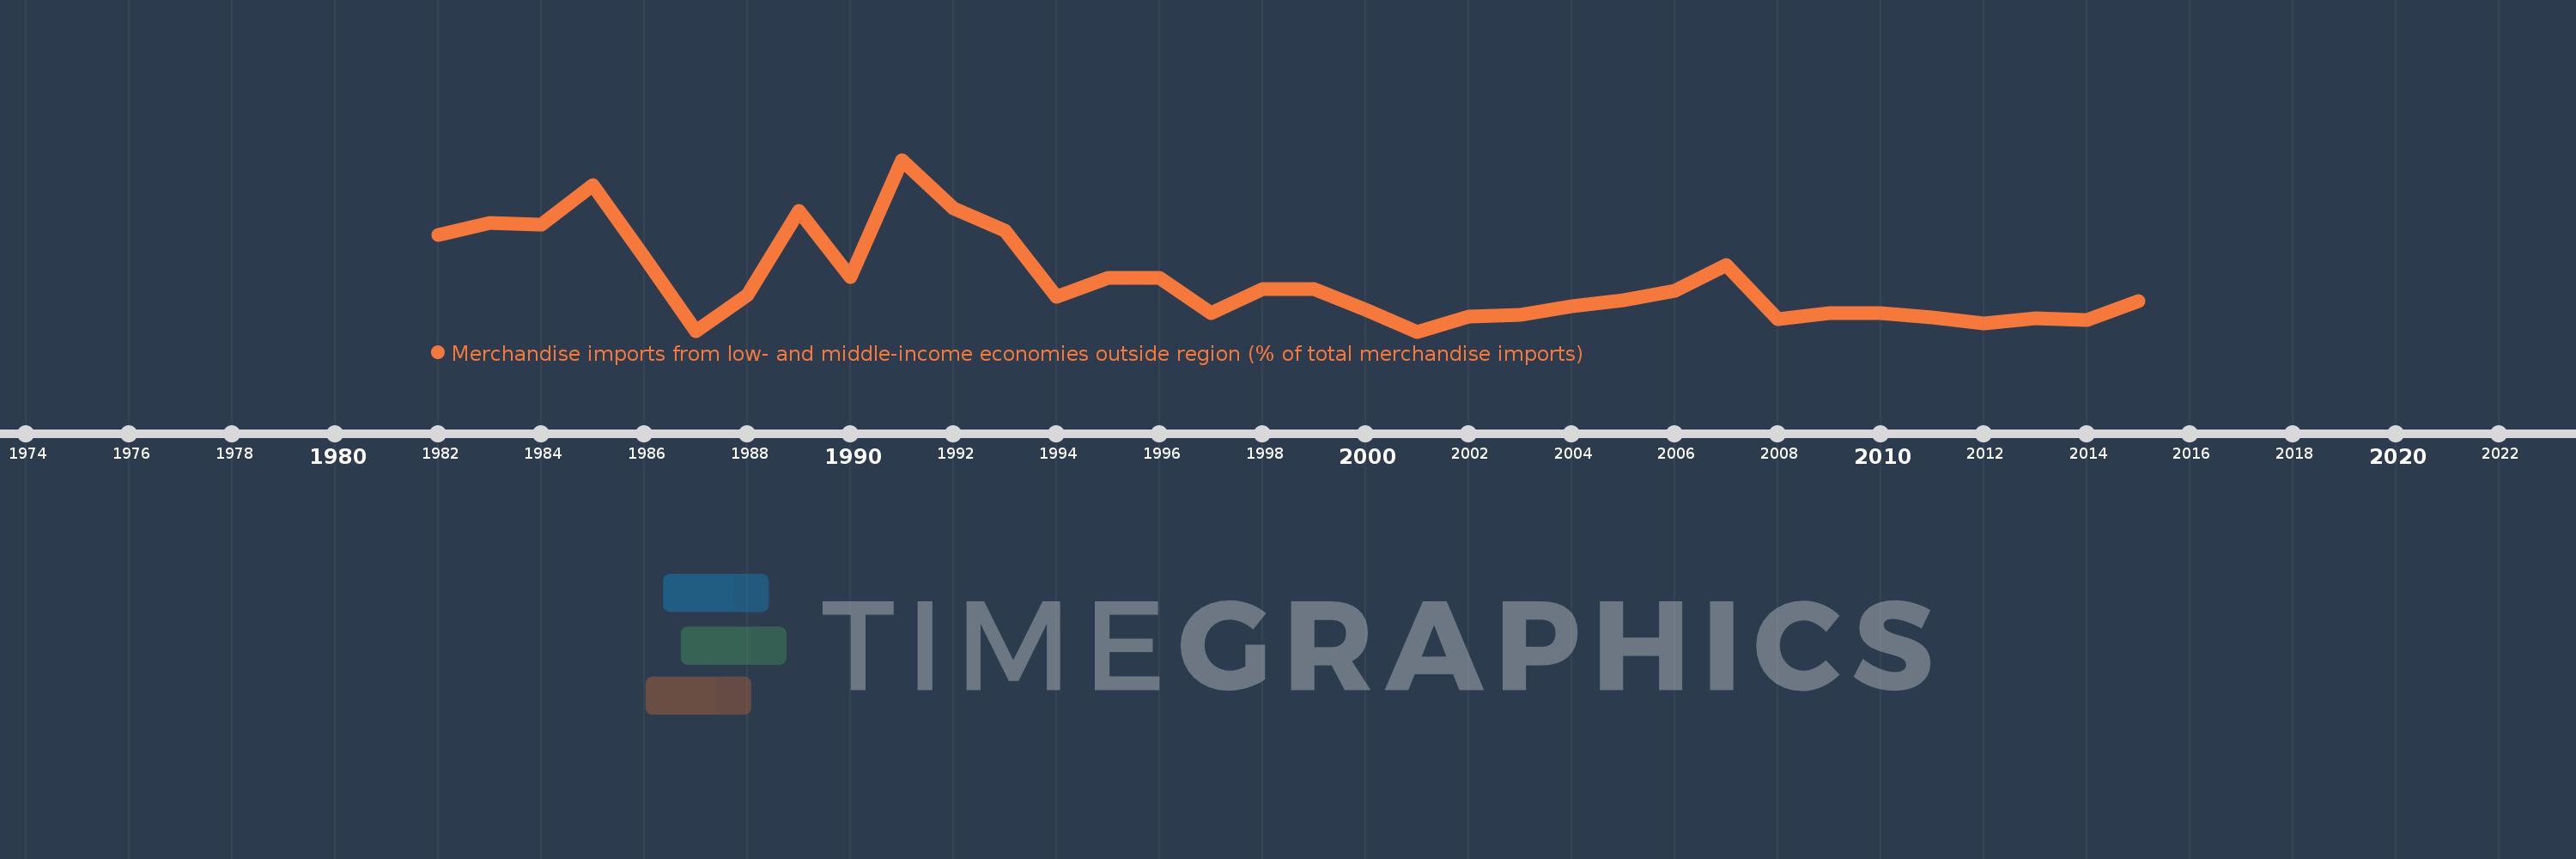
Merchandise imports from low- and middle-income economies outside region (% of total merchandise imports)
2015,2014,2013,2012,2011,2010,2009,2008,2007,2006,2005,2004,2003,2002,2001,2000,1999,1998,1997,1996,1995,1994,1993,1992,1991,1990,1989,1988,1987,1986,1985,1984,1983,1982
Estas estadísticas en otros países:
AfghanistanAlbaniaAlgeriaAngolaArab WorldArgentinaArmeniaArubaAustraliaAustriaAzerbaijanBahamas, TheBahrainBangladeshBarbadosBelarusBelgiumBelizeBeninBermudaBoliviaBrazilBrunei DarussalamBulgariaBurkina FasoBurundiCabo VerdeCambodiaCameroonCanadaCaribbean small statesCentral African RepublicCentral Europe and the BalticsChileChinaColombiaCongo, Dem. Rep.Congo, Rep.Costa RicaCote d'IvoireCroatiaCubaCyprusCzech RepublicDenmarkDominicaDominican RepublicEarly-demographic dividendEast Asia & PacificEast Asia & Pacific (excluding high income)East Asia & Pacific (IDA & IBRD countries)EcuadorEgypt, Arab Rep.El SalvadorEstoniaEthiopiaEuro areaEurope & Central AsiaEurope & Central Asia (excluding high income)Europe & Central Asia (IDA & IBRD countries)European UnionFijiFinlandFragile and conflict affected situationsFranceGabonGambia, TheGeorgiaGermanyGhanaGreeceGreenlandGrenadaGuatemalaGuineaGuyanaHaitiHeavily indebted poor countries (HIPC)High incomeHondurasHong Kong SAR, ChinaHungaryIBRD onlyIcelandIDA & IBRD totalIDA blendIDA onlyIDA totalIndiaIndonesiaIran, Islamic Rep.IraqIrelandIsraelItalyJamaicaJapanJordanKazakhstanKenyaKorea, Dem. People’s Rep.Korea, Rep.KuwaitKyrgyz RepublicLao PDRLate-demographic dividendLatin America & Caribbean Latin America & Caribbean (excluding high income)Latin America & the Caribbean (IDA & IBRD countries)LatviaLeast developed countries: UN classificationLebanonLiberiaLibyaLithuaniaLow & middle incomeLow incomeLower middle incomeLuxembourgMacao SAR, ChinaMacedonia, FYRMadagascarMalawiMalaysiaMaliMaltaMauritaniaMauritiusMexicoMiddle East & North AfricaMiddle East & North Africa (excluding high income)Middle East & North Africa (IDA & IBRD countries)Middle incomeMoldovaMongoliaMontenegroMoroccoMozambiqueMyanmarNetherlandsNew CaledoniaNew ZealandNicaraguaNigerNigeriaNorth AmericaNorwayOECD membersOmanOther small statesPacific island small statesPakistanPanamaPapua New GuineaParaguayPeruPhilippinesPolandPortugalPost-demographic dividendPre-demographic dividendQatarRomaniaRussian FederationRwandaSaudi ArabiaSenegalSerbiaSeychellesSierra LeoneSingaporeSlovak RepublicSloveniaSmall statesSomaliaSouth AfricaSouth AsiaSouth Asia (IDA & IBRD)SpainSri LankaSt. Kitts and NevisSt. LuciaSt. Vincent and the GrenadinesSub-Saharan Africa Sub-Saharan Africa (excluding high income)Sub-Saharan Africa (IDA & IBRD countries)SudanSurinameSwedenSwitzerlandSyrian Arab RepublicTanzaniaThailandTogoTrinidad and TobagoTunisiaTurkeyUgandaUkraineUnited Arab EmiratesUnited KingdomUnited StatesUpper middle incomeUruguayVenezuela, RBVietnamWorldYemen, Rep.ZambiaZimbabwe línea de tiempo (timeline):
En esta escala de tiempo se presenta un gráfico de 1982 y 2015 de Bulgaria. Los datos de 1981 están ausentes. El número de observaciones reales por fecha: 34.
Fuente (nombre):
Indicadores del desarrollo mundial
Fuente (organización):
World Bank staff estimates based data from International Monetary Fund's Direction of Trade database.
Categorías:
Private Sector, Trade
Se ha actualizado:
23 abr 2017 año
Los indicadores de los cambios de valor en los últimos años
Mínimo:
4.789
1 ene 2001 año
Máximo:
19.359
1 ene 1991 año
A la fecha de observación
Valor
Cambio absoluto
El cambio con respecto al valor anterior
1 ene 1982 año
13.004
+13.004
0.0%
1 ene 1983 año
14.04
+1.036
7.97%
1 ene 1984 año
13.876
-0.164
-1.17%
1 ene 1985 año
17.191
+3.315
23.89%
1 ene 1986 año
11.12
-6.072
-35.32%
1 ene 1987 año
4.811
-6.308
-56.73%
1 ene 1988 año
7.886
+3.075
63.91%
1 ene 1989 año
15.045
+7.159
90.78%
1 ene 1990 año
9.446
-5.599
-37.22%
1 ene 1991 año
19.359
+9.914
104.95%
1 ene 1992 año
15.259
-4.1
-21.18%
1 ene 1993 año
13.353
-1.906
-12.49%
1 ene 1994 año
7.722
-5.631
-42.17%
1 ene 1995 año
9.307
+1.584
20.52%
1 ene 1996 año
9.356
+0.049
0.53%
1 ene 1997 año
6.339
-3.017
-32.24%
1 ene 1998 año
8.377
+2.038
32.15%
1 ene 1999 año
8.403
+0.026
0.3%
1 ene 2000 año
6.649
-1.754
-20.87%
1 ene 2001 año
4.789
-1.86
-27.97%
1 ene 2002 año
6.061
+1.272
26.56%
1 ene 2003 año
6.242
+0.181
2.98%
1 ene 2004 año
6.959
+0.717
11.49%
1 ene 2005 año
7.457
+0.498
7.16%
1 ene 2006 año
8.283
+0.826
11.08%
1 ene 2007 año
10.405
+2.122
25.62%
1 ene 2008 año
5.819
-4.586
-44.08%
1 ene 2009 año
6.362
+0.543
9.33%
1 ene 2010 año
6.339
-0.023
-0.35%
1 ene 2011 año
6.027
-0.312
-4.92%
1 ene 2012 año
5.506
-0.522
-8.65%
1 ene 2013 año
5.932
+0.426
7.75%
1 ene 2014 año
5.754
-0.178
-3.0%
1 ene 2015 año
7.379
+1.626
28.25%
Ranking de los países por los datos estadísticos actuales


Comentarios: