29
/es/
es
AIzaSyAYiBZKx7MnpbEhh9jyipgxe19OcubqV5w
April 1, 2024
139536
Germany
DEU
true
2
1
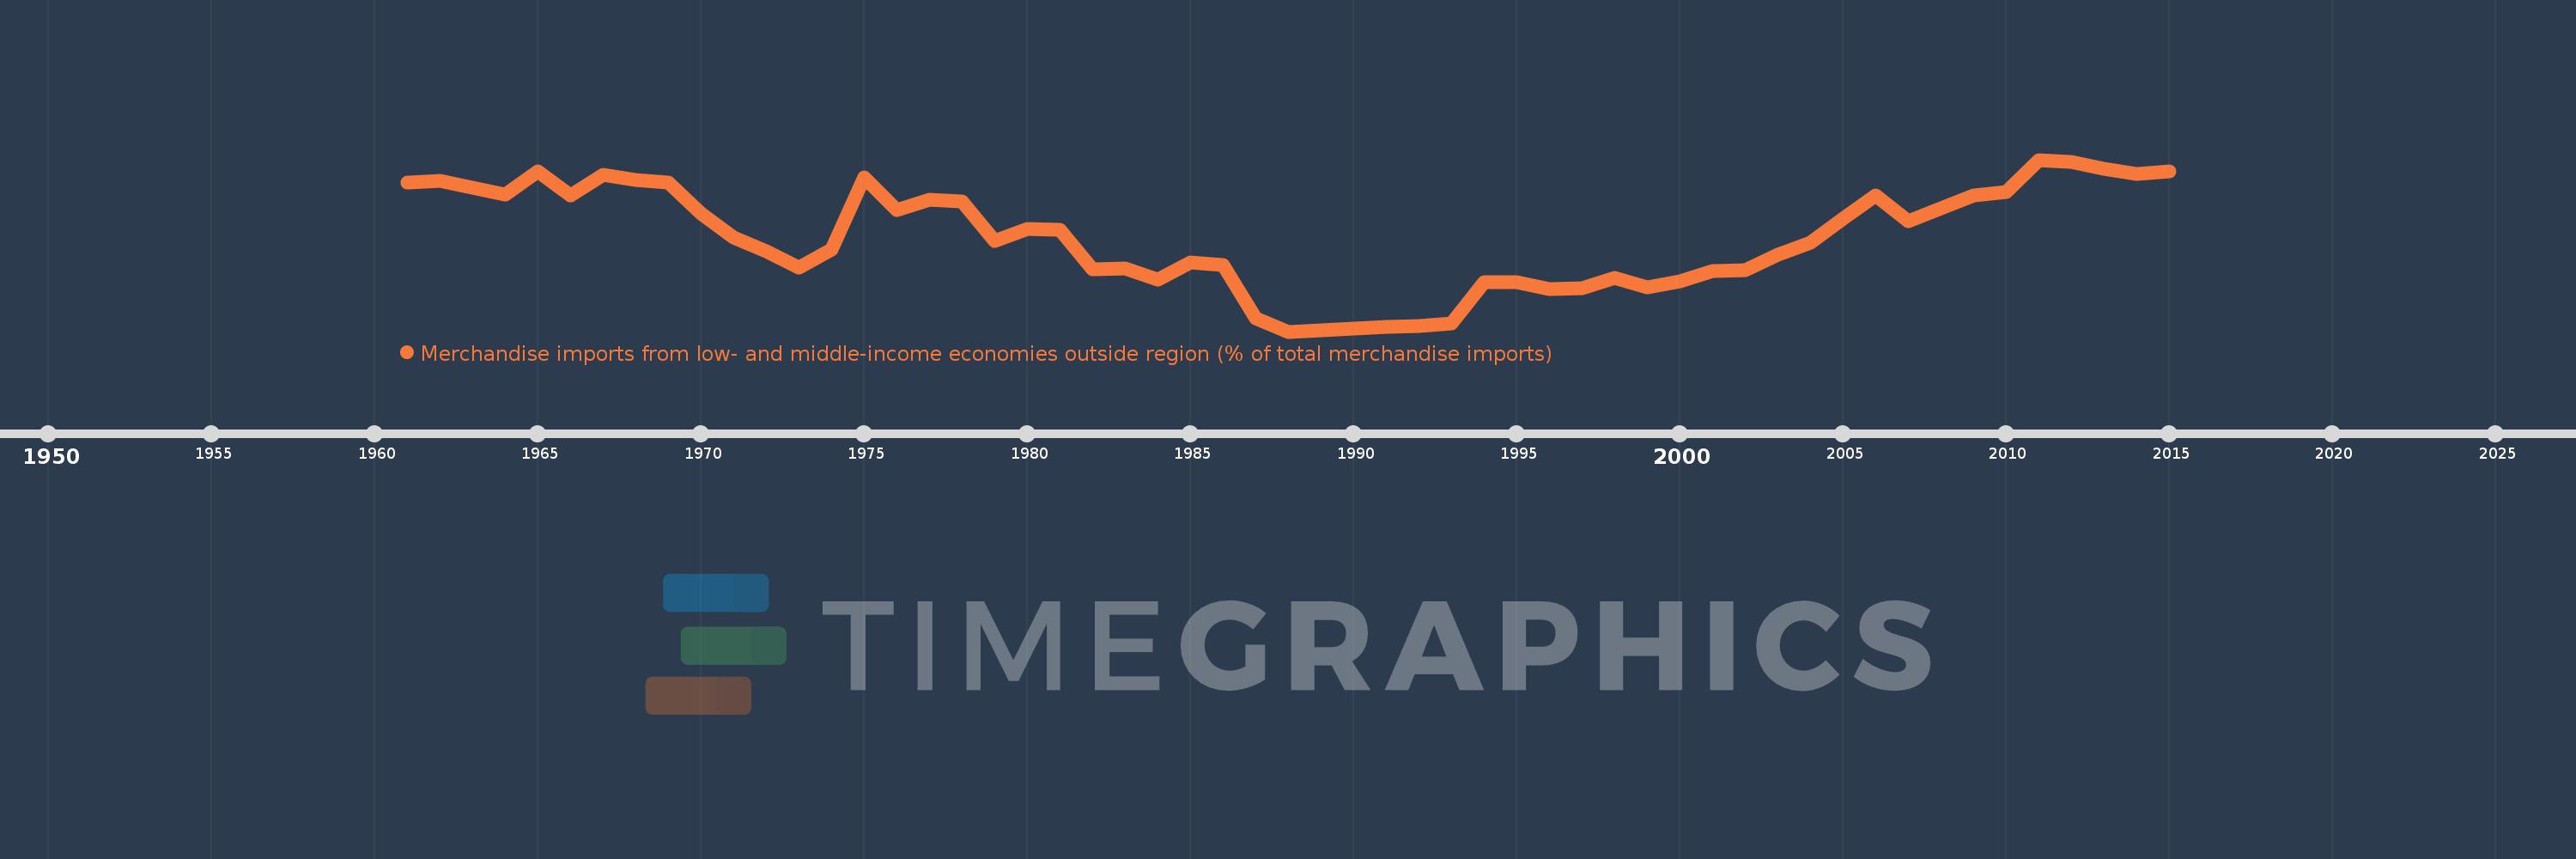
Merchandise imports from low- and middle-income economies outside region (% of total merchandise imports)
2015,2014,2013,2012,2011,2010,2009,2008,2007,2006,2005,2004,2003,2002,2001,2000,1999,1998,1997,1996,1995,1994,1993,1992,1991,1990,1989,1988,1987,1986,1985,1984,1983,1982,1981,1980,1979,1978,1977,1976,1975,1974,1973,1972,1971,1970,1969,1968,1967,1966,1965,1964,1963,1962,1961
Estas estadísticas en otros países:
AfghanistanAlbaniaAlgeriaAngolaArab WorldArgentinaArmeniaArubaAustraliaAustriaAzerbaijanBahamas, TheBahrainBangladeshBarbadosBelarusBelgiumBelizeBeninBermudaBoliviaBrazilBrunei DarussalamBulgariaBurkina FasoBurundiCabo VerdeCambodiaCameroonCanadaCaribbean small statesCentral African RepublicCentral Europe and the BalticsChileChinaColombiaCongo, Dem. Rep.Congo, Rep.Costa RicaCote d'IvoireCroatiaCubaCyprusCzech RepublicDenmarkDominicaDominican RepublicEarly-demographic dividendEast Asia & PacificEast Asia & Pacific (excluding high income)East Asia & Pacific (IDA & IBRD countries)EcuadorEgypt, Arab Rep.El SalvadorEstoniaEthiopiaEuro areaEurope & Central AsiaEurope & Central Asia (excluding high income)Europe & Central Asia (IDA & IBRD countries)European UnionFijiFinlandFragile and conflict affected situationsFranceGabonGambia, TheGeorgiaGermanyGhanaGreeceGreenlandGrenadaGuatemalaGuineaGuyanaHaitiHeavily indebted poor countries (HIPC)High incomeHondurasHong Kong SAR, ChinaHungaryIBRD onlyIcelandIDA & IBRD totalIDA blendIDA onlyIDA totalIndiaIndonesiaIran, Islamic Rep.IraqIrelandIsraelItalyJamaicaJapanJordanKazakhstanKenyaKorea, Dem. People’s Rep.Korea, Rep.KuwaitKyrgyz RepublicLao PDRLate-demographic dividendLatin America & Caribbean Latin America & Caribbean (excluding high income)Latin America & the Caribbean (IDA & IBRD countries)LatviaLeast developed countries: UN classificationLebanonLiberiaLibyaLithuaniaLow & middle incomeLow incomeLower middle incomeLuxembourgMacao SAR, ChinaMacedonia, FYRMadagascarMalawiMalaysiaMaliMaltaMauritaniaMauritiusMexicoMiddle East & North AfricaMiddle East & North Africa (excluding high income)Middle East & North Africa (IDA & IBRD countries)Middle incomeMoldovaMongoliaMontenegroMoroccoMozambiqueMyanmarNetherlandsNew CaledoniaNew ZealandNicaraguaNigerNigeriaNorth AmericaNorwayOECD membersOmanOther small statesPacific island small statesPakistanPanamaPapua New GuineaParaguayPeruPhilippinesPolandPortugalPost-demographic dividendPre-demographic dividendQatarRomaniaRussian FederationRwandaSaudi ArabiaSenegalSerbiaSeychellesSierra LeoneSingaporeSlovak RepublicSloveniaSmall statesSomaliaSouth AfricaSouth AsiaSouth Asia (IDA & IBRD)SpainSri LankaSt. Kitts and NevisSt. LuciaSt. Vincent and the GrenadinesSub-Saharan Africa Sub-Saharan Africa (excluding high income)Sub-Saharan Africa (IDA & IBRD countries)SudanSurinameSwedenSwitzerlandSyrian Arab RepublicTanzaniaThailandTogoTrinidad and TobagoTunisiaTurkeyUgandaUkraineUnited Arab EmiratesUnited KingdomUnited StatesUpper middle incomeUruguayVenezuela, RBVietnamWorldYemen, Rep.ZambiaZimbabwe línea de tiempo (timeline):
En esta escala de tiempo se presenta un gráfico de 1961 y 2015 de Germany. Los datos de 1960 están ausentes. El número de observaciones reales por fecha: 55.
Fuente (nombre):
Indicadores del desarrollo mundial
Fuente (organización):
World Bank staff estimates based data from International Monetary Fund's Direction of Trade database.
Categorías:
Private Sector, Trade
Se ha actualizado:
23 abr 2017 año
Los indicadores de los cambios de valor en los últimos años
Mínimo:
9.905
1 ene 1988 año
Máximo:
17.677
1 ene 2011 año
A la fecha de observación
Valor
Cambio absoluto
El cambio con respecto al valor anterior
1 ene 1961 año
16.658
+16.658
0.0%
1 ene 1962 año
16.716
+0.057
0.34%
1 ene 1963 año
16.405
-0.31
-1.86%
1 ene 1964 año
16.113
-0.292
-1.78%
1 ene 1965 año
17.137
+1.024
6.35%
1 ene 1966 año
16.047
-1.09
-6.36%
1 ene 1967 año
16.998
+0.951
5.93%
1 ene 1968 año
16.759
-0.239
-1.41%
1 ene 1969 año
16.643
-0.116
-0.69%
1 ene 1970 año
15.258
-1.385
-8.32%
1 ene 1971 año
14.141
-1.117
-7.32%
1 ene 1972 año
13.526
-0.615
-4.35%
1 ene 1973 año
12.793
-0.732
-5.41%
1 ene 1974 año
13.625
+0.831
6.5%
1 ene 1975 año
16.863
+3.238
23.77%
1 ene 1976 año
15.42
-1.443
-8.56%
1 ene 1977 año
15.858
+0.438
2.84%
1 ene 1978 año
15.799
-0.059
-0.37%
1 ene 1979 año
14.0
-1.799
-11.39%
1 ene 1980 año
14.54
+0.54
3.85%
1 ene 1981 año
14.491
-0.049
-0.34%
1 ene 1982 año
12.717
-1.773
-12.24%
1 ene 1983 año
12.777
+0.06
0.47%
1 ene 1984 año
12.252
-0.525
-4.11%
1 ene 1985 año
13.051
+0.799
6.52%
1 ene 1986 año
12.902
-0.15
-1.15%
1 ene 1987 año
10.494
-2.408
-18.66%
1 ene 1988 año
9.905
-0.588
-5.61%
1 ene 1989 año
9.966
+0.061
0.61%
1 ene 1990 año
10.031
+0.065
0.65%
1 ene 1991 año
10.108
+0.077
0.77%
1 ene 1992 año
10.168
+0.06
0.59%
1 ene 1993 año
10.266
+0.098
0.97%
1 ene 1994 año
12.137
+1.87
18.22%
1 ene 1995 año
12.138
+0.001
0.01%
1 ene 1996 año
11.835
-0.303
-2.49%
1 ene 1997 año
11.871
+0.036
0.3%
1 ene 1998 año
12.325
+0.454
3.83%
1 ene 1999 año
11.902
-0.423
-3.43%
1 ene 2000 año
12.18
+0.278
2.33%
1 ene 2001 año
12.662
+0.482
3.96%
1 ene 2002 año
12.696
+0.034
0.27%
1 ene 2003 año
13.389
+0.693
5.46%
1 ene 2004 año
13.92
+0.531
3.96%
1 ene 2005 año
15.012
+1.093
7.85%
1 ene 2006 año
16.071
+1.059
7.05%
1 ene 2007 año
14.914
-1.157
-7.2%
1 ene 2008 año
15.497
+0.584
3.91%
1 ene 2009 año
16.062
+0.564
3.64%
1 ene 2010 año
16.217
+0.155
0.97%
1 ene 2011 año
17.677
+1.46
9.0%
1 ene 2012 año
17.574
-0.103
-0.58%
1 ene 2013 año
17.262
-0.311
-1.77%
1 ene 2014 año
17.036
-0.227
-1.31%
1 ene 2015 año
17.168
+0.132
0.77%
Ranking de los países por los datos estadísticos actuales


Comentarios: