29
/es/
es
AIzaSyAYiBZKx7MnpbEhh9jyipgxe19OcubqV5w
April 1, 2024
24303
Arab World
ARB
false
2
1
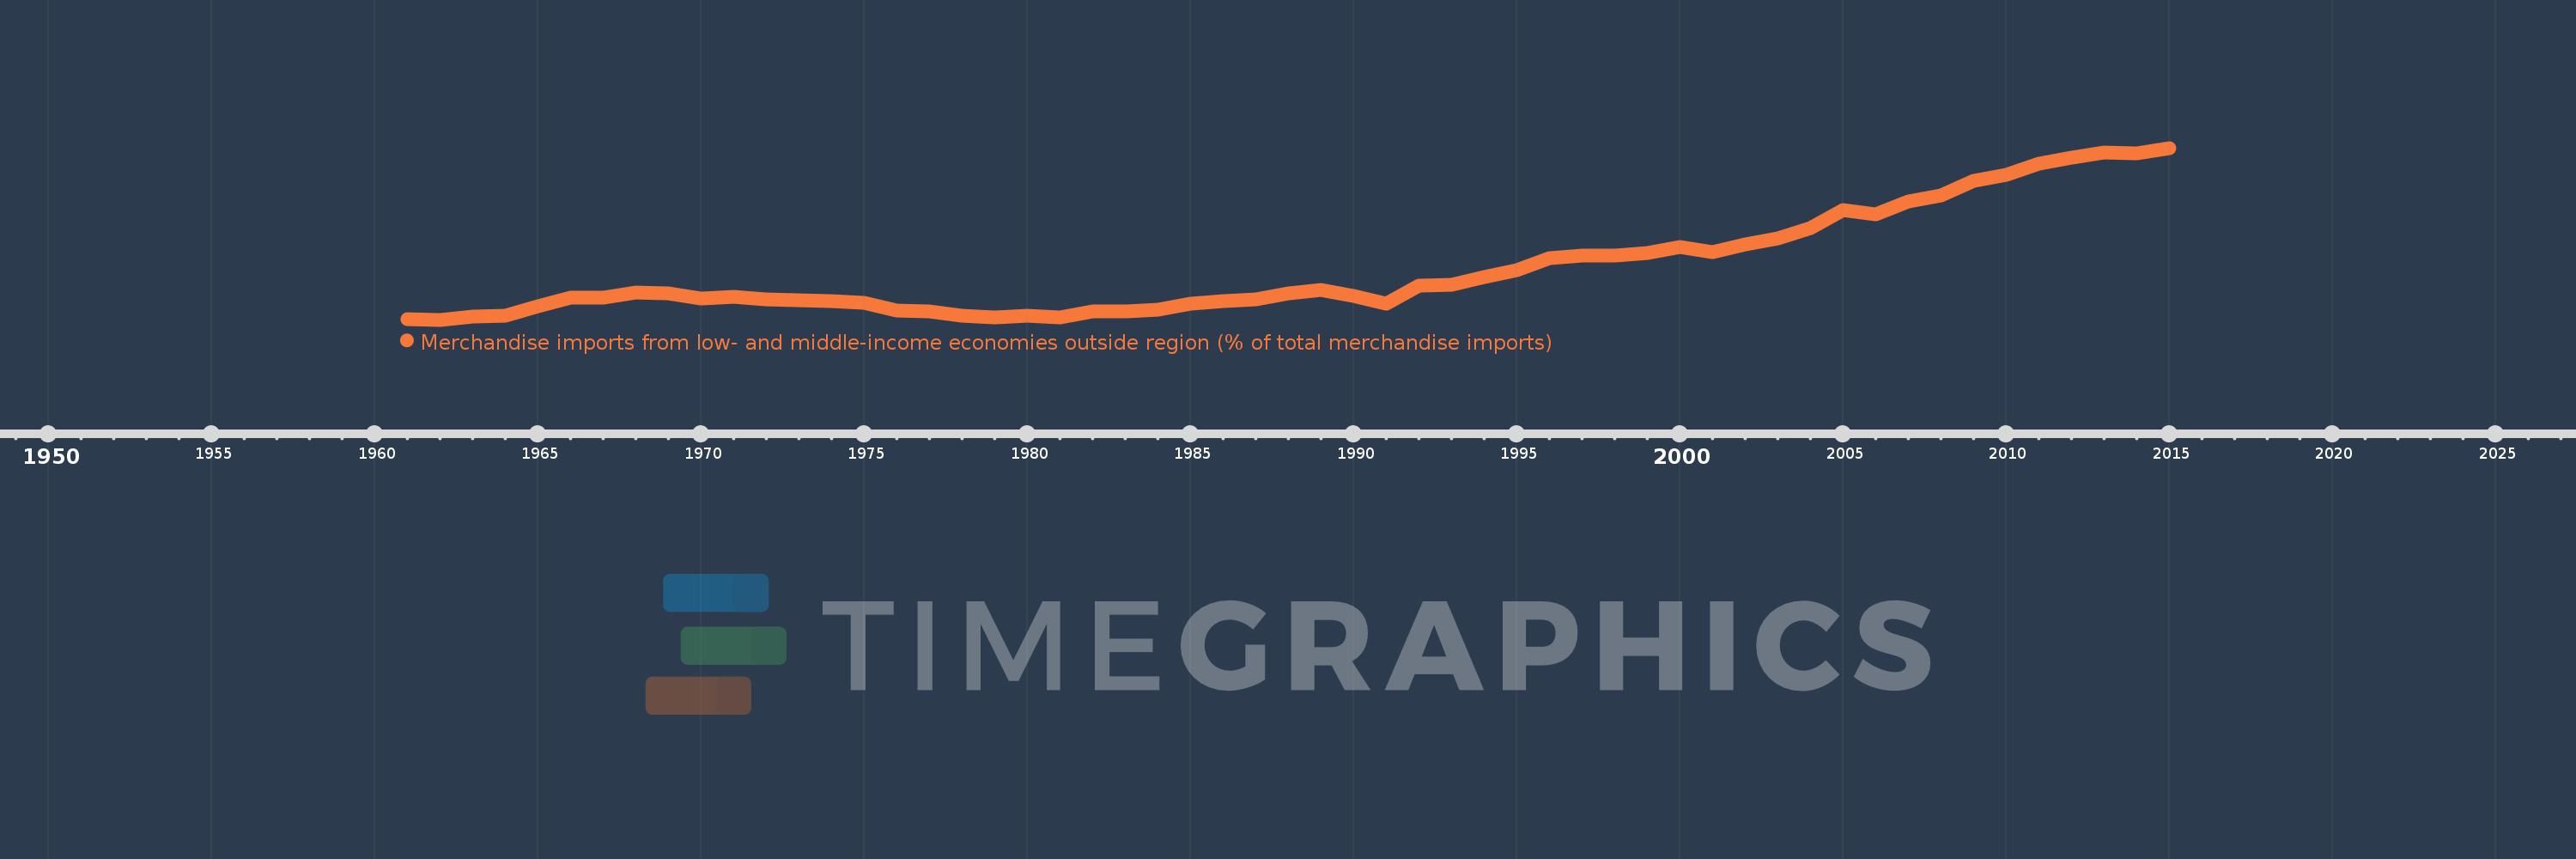
Merchandise imports from low- and middle-income economies outside region (% of total merchandise imports)
2015,2014,2013,2012,2011,2010,2009,2008,2007,2006,2005,2004,2003,2002,2001,2000,1999,1998,1997,1996,1995,1994,1993,1992,1991,1990,1989,1988,1987,1986,1985,1984,1983,1982,1981,1980,1979,1978,1977,1976,1975,1974,1973,1972,1971,1970,1969,1968,1967,1966,1965,1964,1963,1962,1961
Estas estadísticas en otros países:
AfghanistanAlbaniaAlgeriaAngolaArab WorldArgentinaArmeniaArubaAustraliaAustriaAzerbaijanBahamas, TheBahrainBangladeshBarbadosBelarusBelgiumBelizeBeninBermudaBoliviaBrazilBrunei DarussalamBulgariaBurkina FasoBurundiCabo VerdeCambodiaCameroonCanadaCaribbean small statesCentral African RepublicCentral Europe and the BalticsChileChinaColombiaCongo, Dem. Rep.Congo, Rep.Costa RicaCote d'IvoireCroatiaCubaCyprusCzech RepublicDenmarkDominicaDominican RepublicEarly-demographic dividendEast Asia & PacificEast Asia & Pacific (excluding high income)East Asia & Pacific (IDA & IBRD countries)EcuadorEgypt, Arab Rep.El SalvadorEstoniaEthiopiaEuro areaEurope & Central AsiaEurope & Central Asia (excluding high income)Europe & Central Asia (IDA & IBRD countries)European UnionFijiFinlandFragile and conflict affected situationsFranceGabonGambia, TheGeorgiaGermanyGhanaGreeceGreenlandGrenadaGuatemalaGuineaGuyanaHaitiHeavily indebted poor countries (HIPC)High incomeHondurasHong Kong SAR, ChinaHungaryIBRD onlyIcelandIDA & IBRD totalIDA blendIDA onlyIDA totalIndiaIndonesiaIran, Islamic Rep.IraqIrelandIsraelItalyJamaicaJapanJordanKazakhstanKenyaKorea, Dem. People’s Rep.Korea, Rep.KuwaitKyrgyz RepublicLao PDRLate-demographic dividendLatin America & Caribbean Latin America & Caribbean (excluding high income)Latin America & the Caribbean (IDA & IBRD countries)LatviaLeast developed countries: UN classificationLebanonLiberiaLibyaLithuaniaLow & middle incomeLow incomeLower middle incomeLuxembourgMacao SAR, ChinaMacedonia, FYRMadagascarMalawiMalaysiaMaliMaltaMauritaniaMauritiusMexicoMiddle East & North AfricaMiddle East & North Africa (excluding high income)Middle East & North Africa (IDA & IBRD countries)Middle incomeMoldovaMongoliaMontenegroMoroccoMozambiqueMyanmarNetherlandsNew CaledoniaNew ZealandNicaraguaNigerNigeriaNorth AmericaNorwayOECD membersOmanOther small statesPacific island small statesPakistanPanamaPapua New GuineaParaguayPeruPhilippinesPolandPortugalPost-demographic dividendPre-demographic dividendQatarRomaniaRussian FederationRwandaSaudi ArabiaSenegalSerbiaSeychellesSierra LeoneSingaporeSlovak RepublicSloveniaSmall statesSomaliaSouth AfricaSouth AsiaSouth Asia (IDA & IBRD)SpainSri LankaSt. Kitts and NevisSt. LuciaSt. Vincent and the GrenadinesSub-Saharan Africa Sub-Saharan Africa (excluding high income)Sub-Saharan Africa (IDA & IBRD countries)SudanSurinameSwedenSwitzerlandSyrian Arab RepublicTanzaniaThailandTogoTrinidad and TobagoTunisiaTurkeyUgandaUkraineUnited Arab EmiratesUnited KingdomUnited StatesUpper middle incomeUruguayVenezuela, RBVietnamWorldYemen, Rep.ZambiaZimbabwe línea de tiempo (timeline):
En esta escala de tiempo se presenta un gráfico de 1961 y 2015 de Arab World. Los datos de 1960 están ausentes. El número de observaciones reales por fecha: 55.
Fuente (nombre):
Indicadores del desarrollo mundial
Fuente (organización):
World Bank staff estimates based data from International Monetary Fund's Direction of Trade database.
Categorías:
Private Sector, Trade
Se ha actualizado:
23 abr 2017 año
Los indicadores de los cambios de valor en los últimos años
Mínimo:
5.774
1 ene 1962 año
Máximo:
36.151
1 ene 2015 año
A la fecha de observación
Valor
Cambio absoluto
El cambio con respecto al valor anterior
1 ene 1961 año
5.873
+5.873
0.0%
1 ene 1962 año
5.774
-0.099
-1.69%
1 ene 1963 año
6.342
+0.568
9.84%
1 ene 1964 año
6.54
+0.198
3.12%
1 ene 1965 año
8.233
+1.692
25.87%
1 ene 1966 año
9.618
+1.385
16.83%
1 ene 1967 año
9.706
+0.088
0.91%
1 ene 1968 año
10.635
+0.929
9.58%
1 ene 1969 año
10.511
-0.124
-1.17%
1 ene 1970 año
9.574
-0.937
-8.91%
1 ene 1971 año
9.794
+0.22
2.29%
1 ene 1972 año
9.374
-0.42
-4.29%
1 ene 1973 año
9.255
-0.119
-1.27%
1 ene 1974 año
9.088
-0.166
-1.8%
1 ene 1975 año
8.789
-0.299
-3.29%
1 ene 1976 año
7.452
-1.338
-15.22%
1 ene 1977 año
7.29
-0.162
-2.17%
1 ene 1978 año
6.539
-0.751
-10.3%
1 ene 1979 año
6.238
-0.301
-4.6%
1 ene 1980 año
6.505
+0.267
4.28%
1 ene 1981 año
6.131
-0.374
-5.75%
1 ene 1982 año
7.257
+1.125
18.36%
1 ene 1983 año
7.256
-0.001
-0.01%
1 ene 1984 año
7.509
+0.253
3.48%
1 ene 1985 año
8.617
+1.108
14.76%
1 ene 1986 año
8.998
+0.381
4.42%
1 ene 1987 año
9.388
+0.39
4.34%
1 ene 1988 año
10.401
+1.013
10.79%
1 ene 1989 año
10.978
+0.577
5.55%
1 ene 1990 año
9.915
-1.063
-9.68%
1 ene 1991 año
8.665
-1.25
-12.61%
1 ene 1992 año
11.745
+3.08
35.55%
1 ene 1993 año
11.946
+0.2
1.7%
1 ene 1994 año
13.275
+1.329
11.13%
1 ene 1995 año
14.518
+1.244
9.37%
1 ene 1996 año
16.707
+2.189
15.08%
1 ene 1997 año
17.069
+0.362
2.17%
1 ene 1998 año
17.166
+0.097
0.57%
1 ene 1999 año
17.617
+0.45
2.62%
1 ene 2000 año
18.597
+0.98
5.57%
1 ene 2001 año
17.775
-0.822
-4.42%
1 ene 2002 año
19.108
+1.333
7.5%
1 ene 2003 año
20.141
+1.033
5.41%
1 ene 2004 año
21.968
+1.827
9.07%
1 ene 2005 año
25.177
+3.209
14.61%
1 ene 2006 año
24.483
-0.694
-2.76%
1 ene 2007 año
26.666
+2.183
8.91%
1 ene 2008 año
27.721
+1.056
3.96%
1 ene 2009 año
30.364
+2.643
9.53%
1 ene 2010 año
31.469
+1.105
3.64%
1 ene 2011 año
33.31
+1.84
5.85%
1 ene 2012 año
34.46
+1.15
3.45%
1 ene 2013 año
35.311
+0.851
2.47%
1 ene 2014 año
35.184
-0.127
-0.36%
1 ene 2015 año
36.151
+0.966
2.75%
Ranking de los países por los datos estadísticos actuales


Comentarios: