29
/es/
es
AIzaSyAYiBZKx7MnpbEhh9jyipgxe19OcubqV5w
April 1, 2024
153801
Iceland
ISL
true
2
1
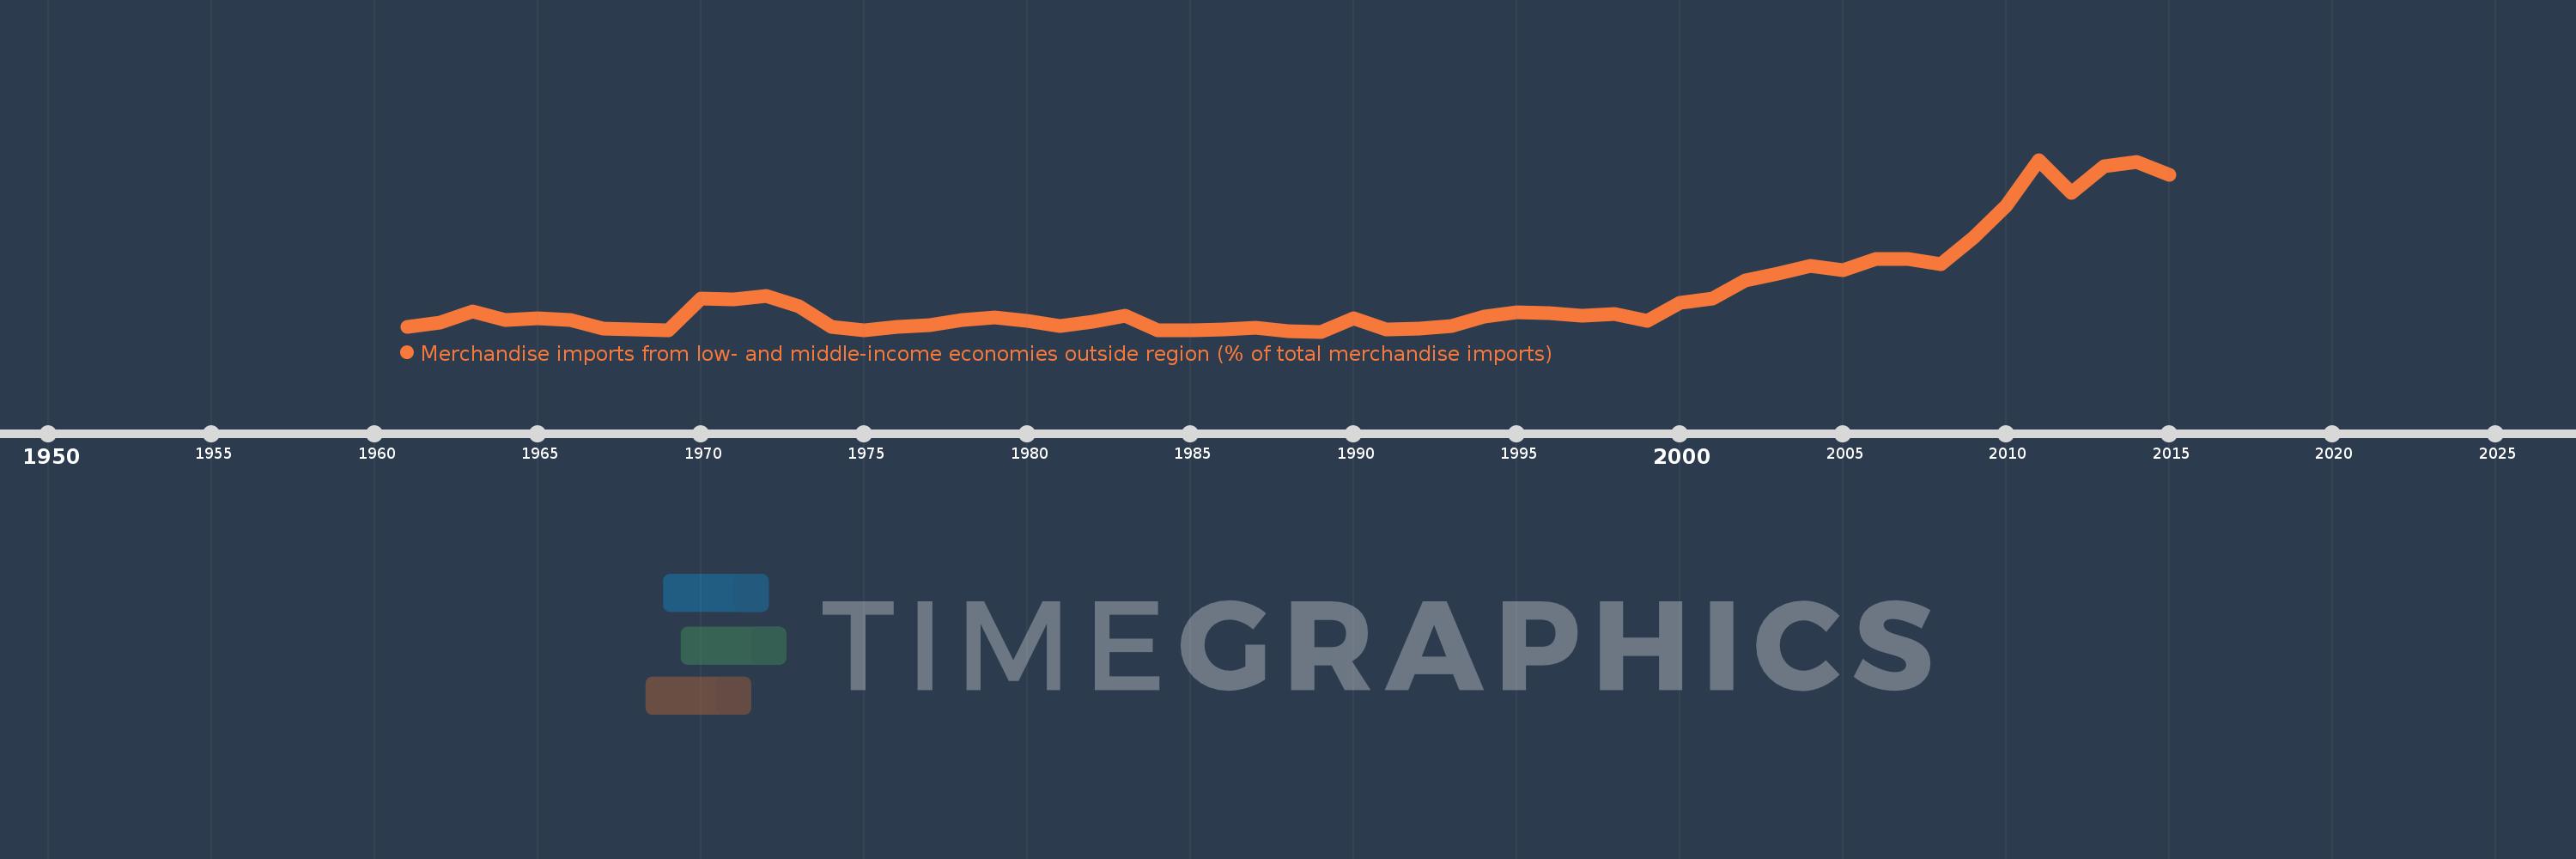
Merchandise imports from low- and middle-income economies outside region (% of total merchandise imports)
2015,2014,2013,2012,2011,2010,2009,2008,2007,2006,2005,2004,2003,2002,2001,2000,1999,1998,1997,1996,1995,1994,1993,1992,1991,1990,1989,1988,1987,1986,1985,1984,1983,1982,1981,1980,1979,1978,1977,1976,1975,1974,1973,1972,1971,1970,1969,1968,1967,1966,1965,1964,1963,1962,1961
Estas estadísticas en otros países:
AfghanistanAlbaniaAlgeriaAngolaArab WorldArgentinaArmeniaArubaAustraliaAustriaAzerbaijanBahamas, TheBahrainBangladeshBarbadosBelarusBelgiumBelizeBeninBermudaBoliviaBrazilBrunei DarussalamBulgariaBurkina FasoBurundiCabo VerdeCambodiaCameroonCanadaCaribbean small statesCentral African RepublicCentral Europe and the BalticsChileChinaColombiaCongo, Dem. Rep.Congo, Rep.Costa RicaCote d'IvoireCroatiaCubaCyprusCzech RepublicDenmarkDominicaDominican RepublicEarly-demographic dividendEast Asia & PacificEast Asia & Pacific (excluding high income)East Asia & Pacific (IDA & IBRD countries)EcuadorEgypt, Arab Rep.El SalvadorEstoniaEthiopiaEuro areaEurope & Central AsiaEurope & Central Asia (excluding high income)Europe & Central Asia (IDA & IBRD countries)European UnionFijiFinlandFragile and conflict affected situationsFranceGabonGambia, TheGeorgiaGermanyGhanaGreeceGreenlandGrenadaGuatemalaGuineaGuyanaHaitiHeavily indebted poor countries (HIPC)High incomeHondurasHong Kong SAR, ChinaHungaryIBRD onlyIcelandIDA & IBRD totalIDA blendIDA onlyIDA totalIndiaIndonesiaIran, Islamic Rep.IraqIrelandIsraelItalyJamaicaJapanJordanKazakhstanKenyaKorea, Dem. People’s Rep.Korea, Rep.KuwaitKyrgyz RepublicLao PDRLate-demographic dividendLatin America & Caribbean Latin America & Caribbean (excluding high income)Latin America & the Caribbean (IDA & IBRD countries)LatviaLeast developed countries: UN classificationLebanonLiberiaLibyaLithuaniaLow & middle incomeLow incomeLower middle incomeLuxembourgMacao SAR, ChinaMacedonia, FYRMadagascarMalawiMalaysiaMaliMaltaMauritaniaMauritiusMexicoMiddle East & North AfricaMiddle East & North Africa (excluding high income)Middle East & North Africa (IDA & IBRD countries)Middle incomeMoldovaMongoliaMontenegroMoroccoMozambiqueMyanmarNetherlandsNew CaledoniaNew ZealandNicaraguaNigerNigeriaNorth AmericaNorwayOECD membersOmanOther small statesPacific island small statesPakistanPanamaPapua New GuineaParaguayPeruPhilippinesPolandPortugalPost-demographic dividendPre-demographic dividendQatarRomaniaRussian FederationRwandaSaudi ArabiaSenegalSerbiaSeychellesSierra LeoneSingaporeSlovak RepublicSloveniaSmall statesSomaliaSouth AfricaSouth AsiaSouth Asia (IDA & IBRD)SpainSri LankaSt. Kitts and NevisSt. LuciaSt. Vincent and the GrenadinesSub-Saharan Africa Sub-Saharan Africa (excluding high income)Sub-Saharan Africa (IDA & IBRD countries)SudanSurinameSwedenSwitzerlandSyrian Arab RepublicTanzaniaThailandTogoTrinidad and TobagoTunisiaTurkeyUgandaUkraineUnited Arab EmiratesUnited KingdomUnited StatesUpper middle incomeUruguayVenezuela, RBVietnamWorldYemen, Rep.ZambiaZimbabwe línea de tiempo (timeline):
En esta escala de tiempo se presenta un gráfico de 1961 y 2015 de Iceland. Los datos de 1960 están ausentes. El número de observaciones reales por fecha: 55.
Fuente (nombre):
Indicadores del desarrollo mundial
Fuente (organización):
World Bank staff estimates based data from International Monetary Fund's Direction of Trade database.
Categorías:
Private Sector, Trade
Se ha actualizado:
23 abr 2017 año
Los indicadores de los cambios de valor en los últimos años
Mínimo:
1.529
1 ene 1989 año
Máximo:
20.386
1 ene 2011 año
A la fecha de observación
Valor
Cambio absoluto
El cambio con respecto al valor anterior
1 ene 1961 año
2.05
+2.05
0.0%
1 ene 1962 año
2.561
+0.511
24.9%
1 ene 1963 año
3.708
+1.147
44.8%
1 ene 1964 año
2.841
-0.866
-23.37%
1 ene 1965 año
2.984
+0.143
5.02%
1 ene 1966 año
2.768
-0.216
-7.25%
1 ene 1967 año
1.884
-0.883
-31.91%
1 ene 1968 año
1.796
-0.089
-4.71%
1 ene 1969 año
1.676
-0.119
-6.64%
1 ene 1970 año
5.163
+3.486
207.97%
1 ene 1971 año
5.087
-0.076
-1.47%
1 ene 1972 año
5.46
+0.373
7.34%
1 ene 1973 año
4.278
-1.182
-21.65%
1 ene 1974 año
2.05
-2.228
-52.09%
1 ene 1975 año
1.638
-0.412
-20.08%
1 ene 1976 año
2.084
+0.446
27.22%
1 ene 1977 año
2.242
+0.158
7.56%
1 ene 1978 año
2.829
+0.588
26.21%
1 ene 1979 año
3.076
+0.246
8.71%
1 ene 1980 año
2.729
-0.346
-11.26%
1 ene 1981 año
2.185
-0.544
-19.93%
1 ene 1982 año
2.622
+0.437
19.99%
1 ene 1983 año
3.302
+0.68
25.92%
1 ene 1984 año
1.709
-1.593
-48.25%
1 ene 1985 año
1.697
-0.012
-0.69%
1 ene 1986 año
1.721
+0.024
1.42%
1 ene 1987 año
1.918
+0.198
11.49%
1 ene 1988 año
1.576
-0.342
-17.83%
1 ene 1989 año
1.529
-0.047
-3.01%
1 ene 1990 año
3.01
+1.481
96.84%
1 ene 1991 año
1.752
-1.258
-41.8%
1 ene 1992 año
1.88
+0.129
7.34%
1 ene 1993 año
2.159
+0.279
14.82%
1 ene 1994 año
3.175
+1.016
47.08%
1 ene 1995 año
3.65
+0.475
14.95%
1 ene 1996 año
3.522
-0.127
-3.49%
1 ene 1997 año
3.261
-0.262
-7.43%
1 ene 1998 año
3.417
+0.156
4.79%
1 ene 1999 año
2.711
-0.706
-20.66%
1 ene 2000 año
4.72
+2.01
74.13%
1 ene 2001 año
5.171
+0.45
9.54%
1 ene 2002 año
7.172
+2.001
38.7%
1 ene 2003 año
7.922
+0.751
10.47%
1 ene 2004 año
8.723
+0.8
10.1%
1 ene 2005 año
8.278
-0.445
-5.1%
1 ene 2006 año
9.519
+1.241
14.99%
1 ene 2007 año
9.467
-0.052
-0.55%
1 ene 2008 año
8.928
-0.539
-5.69%
1 ene 2009 año
11.878
+2.95
33.05%
1 ene 2010 año
15.335
+3.457
29.1%
1 ene 2011 año
20.386
+5.052
32.94%
1 ene 2012 año
16.787
-3.6
-17.66%
1 ene 2013 año
19.633
+2.846
16.95%
1 ene 2014 año
20.189
+0.556
2.83%
1 ene 2015 año
18.695
-1.494
-7.4%
Ranking de los países por los datos estadísticos actuales


Comentarios: