29
/es/
es
AIzaSyAYiBZKx7MnpbEhh9jyipgxe19OcubqV5w
April 1, 2024
125096
Egypt, Arab Rep.
EGY
true
2
1
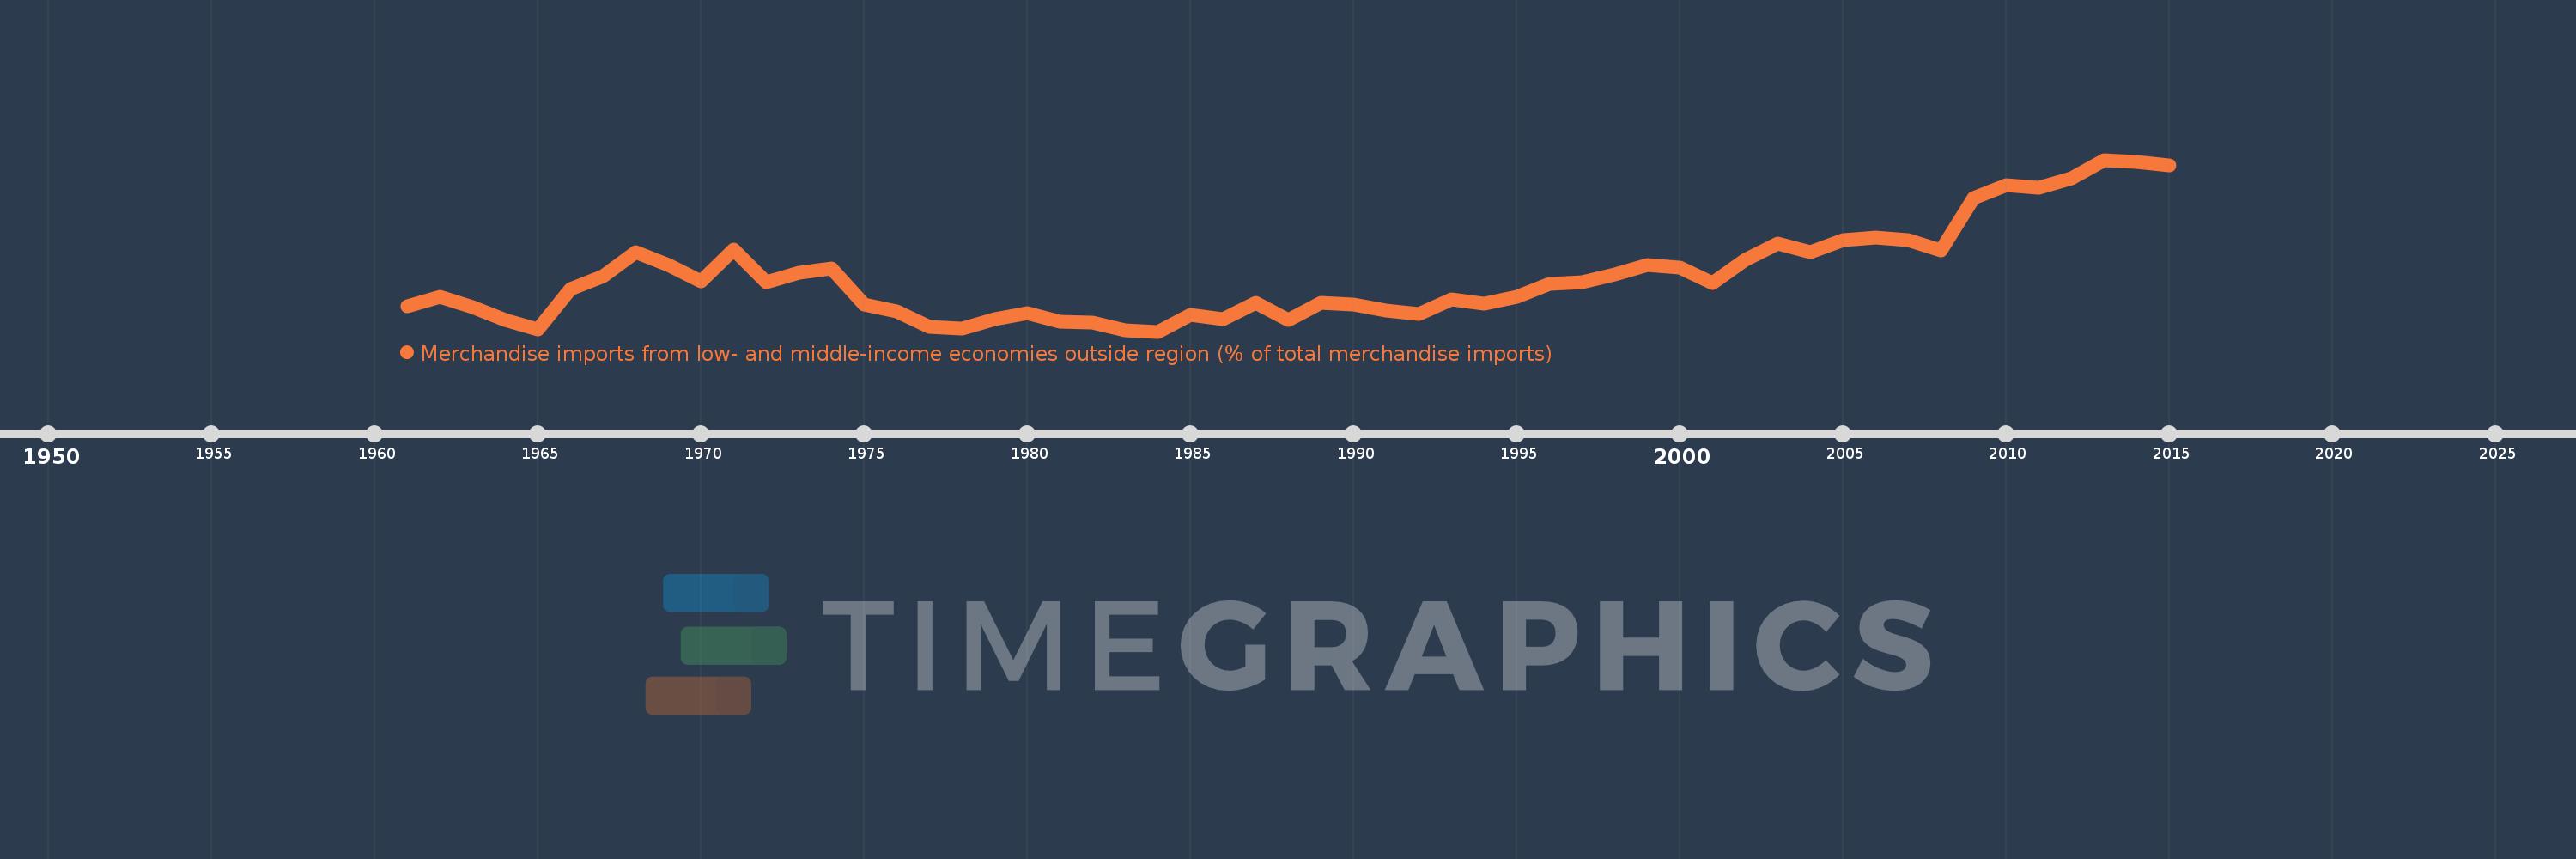
Merchandise imports from low- and middle-income economies outside region (% of total merchandise imports)
2015,2014,2013,2012,2011,2010,2009,2008,2007,2006,2005,2004,2003,2002,2001,2000,1999,1998,1997,1996,1995,1994,1993,1992,1991,1990,1989,1988,1987,1986,1985,1984,1983,1982,1981,1980,1979,1978,1977,1976,1975,1974,1973,1972,1971,1970,1969,1968,1967,1966,1965,1964,1963,1962,1961
Estas estadísticas en otros países:
AfghanistanAlbaniaAlgeriaAngolaArab WorldArgentinaArmeniaArubaAustraliaAustriaAzerbaijanBahamas, TheBahrainBangladeshBarbadosBelarusBelgiumBelizeBeninBermudaBoliviaBrazilBrunei DarussalamBulgariaBurkina FasoBurundiCabo VerdeCambodiaCameroonCanadaCaribbean small statesCentral African RepublicCentral Europe and the BalticsChileChinaColombiaCongo, Dem. Rep.Congo, Rep.Costa RicaCote d'IvoireCroatiaCubaCyprusCzech RepublicDenmarkDominicaDominican RepublicEarly-demographic dividendEast Asia & PacificEast Asia & Pacific (excluding high income)East Asia & Pacific (IDA & IBRD countries)EcuadorEgypt, Arab Rep.El SalvadorEstoniaEthiopiaEuro areaEurope & Central AsiaEurope & Central Asia (excluding high income)Europe & Central Asia (IDA & IBRD countries)European UnionFijiFinlandFragile and conflict affected situationsFranceGabonGambia, TheGeorgiaGermanyGhanaGreeceGreenlandGrenadaGuatemalaGuineaGuyanaHaitiHeavily indebted poor countries (HIPC)High incomeHondurasHong Kong SAR, ChinaHungaryIBRD onlyIcelandIDA & IBRD totalIDA blendIDA onlyIDA totalIndiaIndonesiaIran, Islamic Rep.IraqIrelandIsraelItalyJamaicaJapanJordanKazakhstanKenyaKorea, Dem. People’s Rep.Korea, Rep.KuwaitKyrgyz RepublicLao PDRLate-demographic dividendLatin America & Caribbean Latin America & Caribbean (excluding high income)Latin America & the Caribbean (IDA & IBRD countries)LatviaLeast developed countries: UN classificationLebanonLiberiaLibyaLithuaniaLow & middle incomeLow incomeLower middle incomeLuxembourgMacao SAR, ChinaMacedonia, FYRMadagascarMalawiMalaysiaMaliMaltaMauritaniaMauritiusMexicoMiddle East & North AfricaMiddle East & North Africa (excluding high income)Middle East & North Africa (IDA & IBRD countries)Middle incomeMoldovaMongoliaMontenegroMoroccoMozambiqueMyanmarNetherlandsNew CaledoniaNew ZealandNicaraguaNigerNigeriaNorth AmericaNorwayOECD membersOmanOther small statesPacific island small statesPakistanPanamaPapua New GuineaParaguayPeruPhilippinesPolandPortugalPost-demographic dividendPre-demographic dividendQatarRomaniaRussian FederationRwandaSaudi ArabiaSenegalSerbiaSeychellesSierra LeoneSingaporeSlovak RepublicSloveniaSmall statesSomaliaSouth AfricaSouth AsiaSouth Asia (IDA & IBRD)SpainSri LankaSt. Kitts and NevisSt. LuciaSt. Vincent and the GrenadinesSub-Saharan Africa Sub-Saharan Africa (excluding high income)Sub-Saharan Africa (IDA & IBRD countries)SudanSurinameSwedenSwitzerlandSyrian Arab RepublicTanzaniaThailandTogoTrinidad and TobagoTunisiaTurkeyUgandaUkraineUnited Arab EmiratesUnited KingdomUnited StatesUpper middle incomeUruguayVenezuela, RBVietnamWorldYemen, Rep.ZambiaZimbabwe línea de tiempo (timeline):
En esta escala de tiempo se presenta un gráfico de 1961 y 2015 de Egypt, Arab Rep.. Los datos de 1960 están ausentes. El número de observaciones reales por fecha: 55.
Fuente (nombre):
Indicadores del desarrollo mundial
Fuente (organización):
World Bank staff estimates based data from International Monetary Fund's Direction of Trade database.
Categorías:
Private Sector, Trade
Se ha actualizado:
23 abr 2017 año
Los indicadores de los cambios de valor en los últimos años
Mínimo:
8.261
1 ene 1984 año
Máximo:
33.664
1 ene 2013 año
A la fecha de observación
Valor
Cambio absoluto
El cambio con respecto al valor anterior
1 ene 1961 año
12.048
+12.048
0.0%
1 ene 1962 año
13.378
+1.329
11.03%
1 ene 1963 año
11.83
-1.548
-11.57%
1 ene 1964 año
9.986
-1.844
-15.59%
1 ene 1965 año
8.635
-1.351
-13.53%
1 ene 1966 año
14.551
+5.916
68.51%
1 ene 1967 año
16.506
+1.956
13.44%
1 ene 1968 año
19.992
+3.486
21.12%
1 ene 1969 año
18.162
-1.83
-9.15%
1 ene 1970 año
15.723
-2.439
-13.43%
1 ene 1971 año
20.417
+4.694
29.85%
1 ene 1972 año
15.521
-4.896
-23.98%
1 ene 1973 año
16.97
+1.449
9.33%
1 ene 1974 año
17.575
+0.604
3.56%
1 ene 1975 año
12.285
-5.289
-30.1%
1 ene 1976 año
11.232
-1.053
-8.57%
1 ene 1977 año
8.97
-2.262
-20.14%
1 ene 1978 año
8.694
-0.275
-3.07%
1 ene 1979 año
10.096
+1.402
16.12%
1 ene 1980 año
11.032
+0.936
9.27%
1 ene 1981 año
9.661
-1.37
-12.42%
1 ene 1982 año
9.556
-0.105
-1.09%
1 ene 1983 año
8.511
-1.045
-10.94%
1 ene 1984 año
8.261
-0.25
-2.93%
1 ene 1985 año
10.696
+2.435
29.47%
1 ene 1986 año
10.115
-0.581
-5.43%
1 ene 1987 año
12.529
+2.414
23.86%
1 ene 1988 año
9.956
-2.573
-20.54%
1 ene 1989 año
12.554
+2.598
26.1%
1 ene 1990 año
12.287
-0.266
-2.12%
1 ene 1991 año
11.332
-0.956
-7.78%
1 ene 1992 año
10.833
-0.498
-4.4%
1 ene 1993 año
12.967
+2.134
19.7%
1 ene 1994 año
12.412
-0.555
-4.28%
1 ene 1995 año
13.438
+1.026
8.27%
1 ene 1996 año
15.275
+1.836
13.66%
1 ene 1997 año
15.591
+0.316
2.07%
1 ene 1998 año
16.719
+1.128
7.24%
1 ene 1999 año
18.148
+1.429
8.54%
1 ene 2000 año
17.767
-0.38
-2.1%
1 ene 2001 año
15.432
-2.335
-13.14%
1 ene 2002 año
18.846
+3.414
22.12%
1 ene 2003 año
21.33
+2.484
13.18%
1 ene 2004 año
19.996
-1.335
-6.26%
1 ene 2005 año
21.85
+1.854
9.27%
1 ene 2006 año
22.214
+0.365
1.67%
1 ene 2007 año
21.734
-0.48
-2.16%
1 ene 2008 año
20.258
-1.476
-6.79%
1 ene 2009 año
28.016
+7.758
38.3%
1 ene 2010 año
29.925
+1.909
6.81%
1 ene 2011 año
29.533
-0.392
-1.31%
1 ene 2012 año
30.892
+1.359
4.6%
1 ene 2013 año
33.664
+2.772
8.97%
1 ene 2014 año
33.308
-0.356
-1.06%
1 ene 2015 año
32.8
-0.508
-1.53%
Ranking de los países por los datos estadísticos actuales


Comentarios: