29
/es/
es
AIzaSyAYiBZKx7MnpbEhh9jyipgxe19OcubqV5w
April 1, 2024
170215
Korea, Rep.
KOR
true
2
1
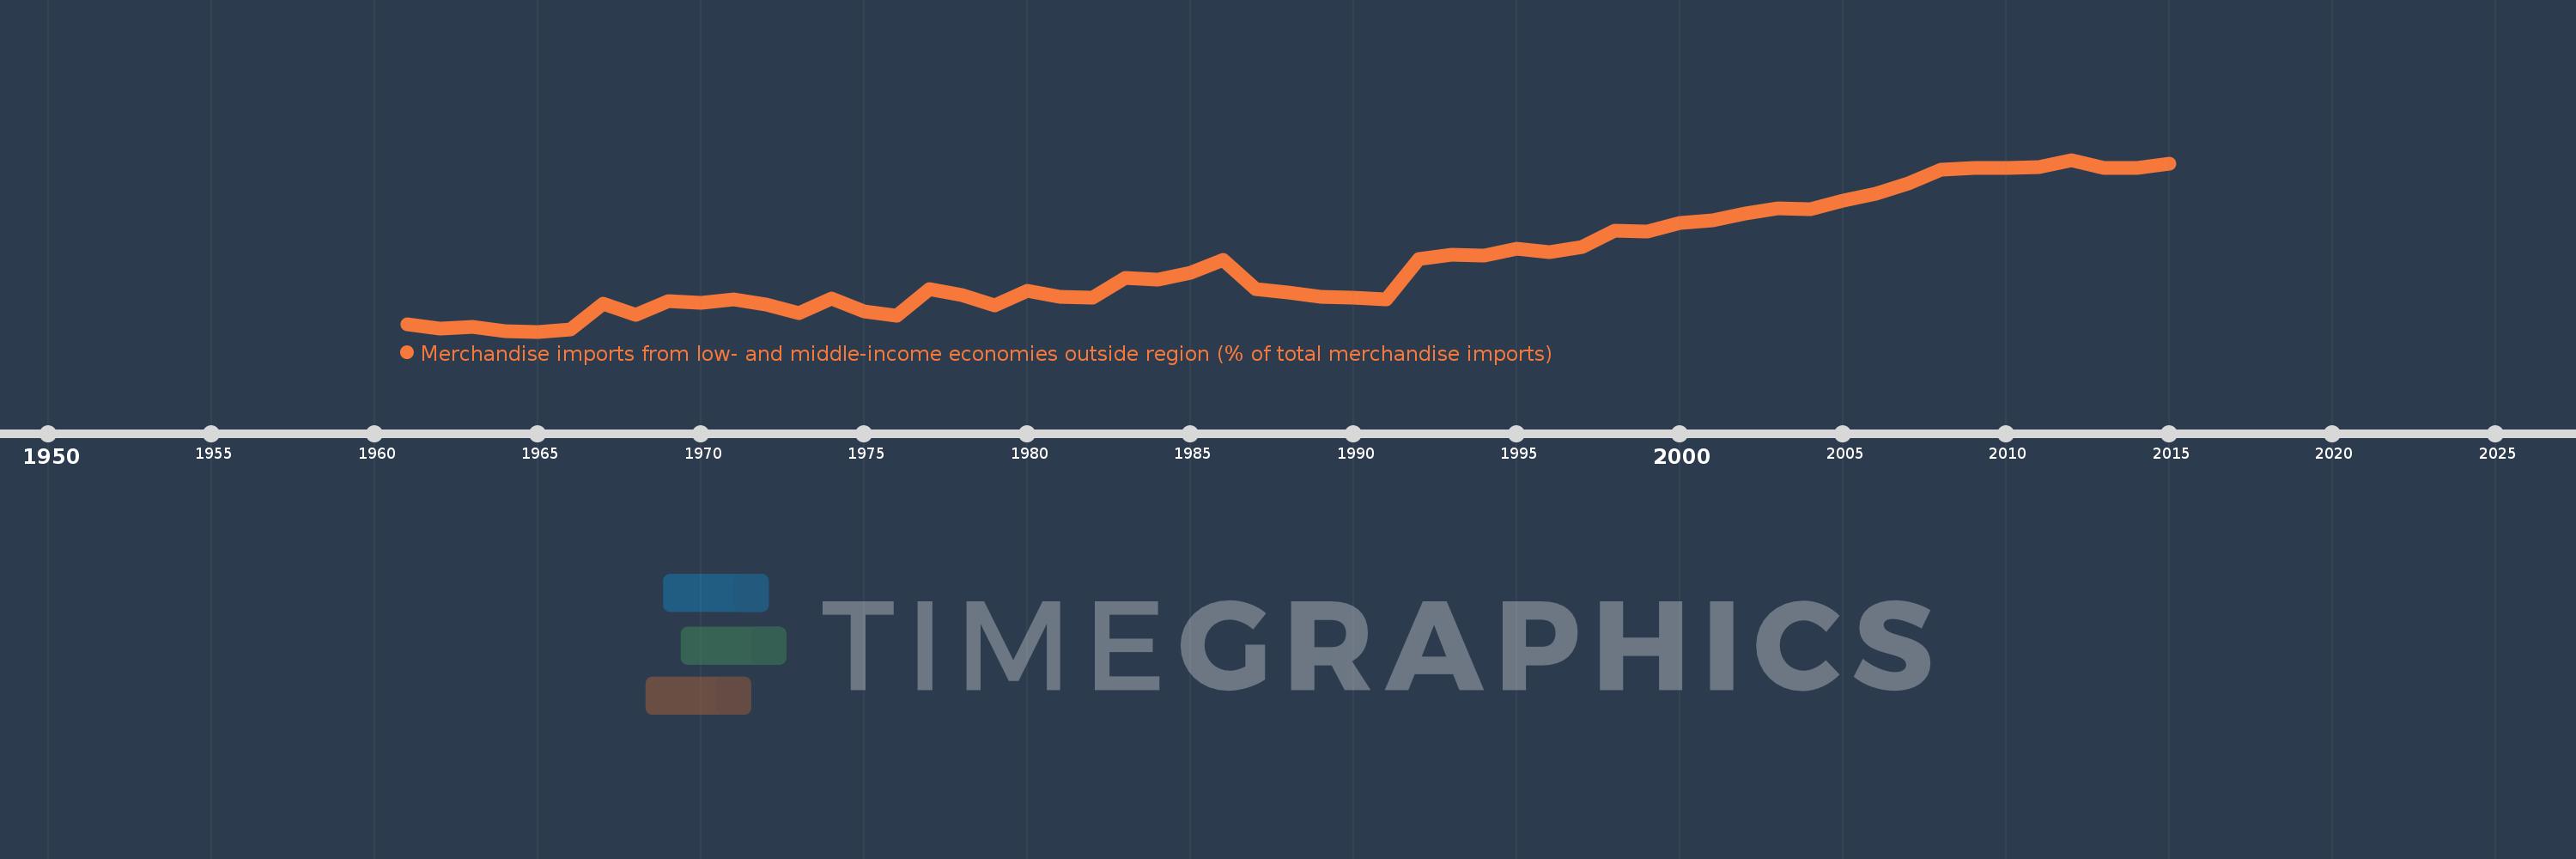
Merchandise imports from low- and middle-income economies outside region (% of total merchandise imports)
2015,2014,2013,2012,2011,2010,2009,2008,2007,2006,2005,2004,2003,2002,2001,2000,1999,1998,1997,1996,1995,1994,1993,1992,1991,1990,1989,1988,1987,1986,1985,1984,1983,1982,1981,1980,1979,1978,1977,1976,1975,1974,1973,1972,1971,1970,1969,1968,1967,1966,1965,1964,1963,1962,1961
Estas estadísticas en otros países:
AfghanistanAlbaniaAlgeriaAngolaArab WorldArgentinaArmeniaArubaAustraliaAustriaAzerbaijanBahamas, TheBahrainBangladeshBarbadosBelarusBelgiumBelizeBeninBermudaBoliviaBrazilBrunei DarussalamBulgariaBurkina FasoBurundiCabo VerdeCambodiaCameroonCanadaCaribbean small statesCentral African RepublicCentral Europe and the BalticsChileChinaColombiaCongo, Dem. Rep.Congo, Rep.Costa RicaCote d'IvoireCroatiaCubaCyprusCzech RepublicDenmarkDominicaDominican RepublicEarly-demographic dividendEast Asia & PacificEast Asia & Pacific (excluding high income)East Asia & Pacific (IDA & IBRD countries)EcuadorEgypt, Arab Rep.El SalvadorEstoniaEthiopiaEuro areaEurope & Central AsiaEurope & Central Asia (excluding high income)Europe & Central Asia (IDA & IBRD countries)European UnionFijiFinlandFragile and conflict affected situationsFranceGabonGambia, TheGeorgiaGermanyGhanaGreeceGreenlandGrenadaGuatemalaGuineaGuyanaHaitiHeavily indebted poor countries (HIPC)High incomeHondurasHong Kong SAR, ChinaHungaryIBRD onlyIcelandIDA & IBRD totalIDA blendIDA onlyIDA totalIndiaIndonesiaIran, Islamic Rep.IraqIrelandIsraelItalyJamaicaJapanJordanKazakhstanKenyaKorea, Dem. People’s Rep.Korea, Rep.KuwaitKyrgyz RepublicLao PDRLate-demographic dividendLatin America & Caribbean Latin America & Caribbean (excluding high income)Latin America & the Caribbean (IDA & IBRD countries)LatviaLeast developed countries: UN classificationLebanonLiberiaLibyaLithuaniaLow & middle incomeLow incomeLower middle incomeLuxembourgMacao SAR, ChinaMacedonia, FYRMadagascarMalawiMalaysiaMaliMaltaMauritaniaMauritiusMexicoMiddle East & North AfricaMiddle East & North Africa (excluding high income)Middle East & North Africa (IDA & IBRD countries)Middle incomeMoldovaMongoliaMontenegroMoroccoMozambiqueMyanmarNetherlandsNew CaledoniaNew ZealandNicaraguaNigerNigeriaNorth AmericaNorwayOECD membersOmanOther small statesPacific island small statesPakistanPanamaPapua New GuineaParaguayPeruPhilippinesPolandPortugalPost-demographic dividendPre-demographic dividendQatarRomaniaRussian FederationRwandaSaudi ArabiaSenegalSerbiaSeychellesSierra LeoneSingaporeSlovak RepublicSloveniaSmall statesSomaliaSouth AfricaSouth AsiaSouth Asia (IDA & IBRD)SpainSri LankaSt. Kitts and NevisSt. LuciaSt. Vincent and the GrenadinesSub-Saharan Africa Sub-Saharan Africa (excluding high income)Sub-Saharan Africa (IDA & IBRD countries)SudanSurinameSwedenSwitzerlandSyrian Arab RepublicTanzaniaThailandTogoTrinidad and TobagoTunisiaTurkeyUgandaUkraineUnited Arab EmiratesUnited KingdomUnited StatesUpper middle incomeUruguayVenezuela, RBVietnamWorldYemen, Rep.ZambiaZimbabwe línea de tiempo (timeline):
En esta escala de tiempo se presenta un gráfico de 1961 y 2015 de Korea, Rep.. Los datos de 1960 están ausentes. El número de observaciones reales por fecha: 55.
Fuente (nombre):
Indicadores del desarrollo mundial
Fuente (organización):
World Bank staff estimates based data from International Monetary Fund's Direction of Trade database.
Categorías:
Private Sector, Trade
Se ha actualizado:
23 abr 2017 año
Los indicadores de los cambios de valor en los últimos años
Mínimo:
2.922
1 ene 1965 año
Máximo:
34.64
1 ene 2012 año
A la fecha de observación
Valor
Cambio absoluto
El cambio con respecto al valor anterior
1 ene 1961 año
4.334
+4.334
0.0%
1 ene 1962 año
3.497
-0.837
-19.31%
1 ene 1963 año
3.771
+0.274
7.85%
1 ene 1964 año
3.018
-0.753
-19.96%
1 ene 1965 año
2.922
-0.096
-3.19%
1 ene 1966 año
3.345
+0.423
14.47%
1 ene 1967 año
8.124
+4.779
142.86%
1 ene 1968 año
5.974
-2.149
-26.46%
1 ene 1969 año
8.549
+2.575
43.09%
1 ene 1970 año
8.183
-0.367
-4.29%
1 ene 1971 año
8.815
+0.632
7.73%
1 ene 1972 año
7.932
-0.883
-10.02%
1 ene 1973 año
6.324
-1.607
-20.26%
1 ene 1974 año
8.973
+2.649
41.88%
1 ene 1975 año
6.668
-2.305
-25.69%
1 ene 1976 año
5.789
-0.88
-13.19%
1 ene 1977 año
10.746
+4.957
85.63%
1 ene 1978 año
9.697
-1.049
-9.76%
1 ene 1979 año
7.742
-1.954
-20.16%
1 ene 1980 año
10.416
+2.674
34.54%
1 ene 1981 año
9.284
-1.132
-10.86%
1 ene 1982 año
9.113
-0.171
-1.84%
1 ene 1983 año
12.804
+3.691
40.5%
1 ene 1984 año
12.541
-0.263
-2.05%
1 ene 1985 año
13.809
+1.267
10.11%
1 ene 1986 año
16.233
+2.424
17.56%
1 ene 1987 año
10.777
-5.456
-33.61%
1 ene 1988 año
10.062
-0.715
-6.63%
1 ene 1989 año
9.272
-0.79
-7.85%
1 ene 1990 año
9.161
-0.111
-1.2%
1 ene 1991 año
8.903
-0.258
-2.82%
1 ene 1992 año
16.261
+7.358
82.65%
1 ene 1993 año
17.086
+0.826
5.08%
1 ene 1994 año
16.998
-0.089
-0.52%
1 ene 1995 año
18.276
+1.279
7.52%
1 ene 1996 año
17.579
-0.697
-3.81%
1 ene 1997 año
18.465
+0.886
5.04%
1 ene 1998 año
21.502
+3.036
16.44%
1 ene 1999 año
21.368
-0.134
-0.62%
1 ene 2000 año
23.008
+1.639
7.67%
1 ene 2001 año
23.446
+0.438
1.91%
1 ene 2002 año
24.72
+1.274
5.43%
1 ene 2003 año
25.657
+0.937
3.79%
1 ene 2004 año
25.525
-0.132
-0.52%
1 ene 2005 año
27.173
+1.648
6.45%
1 ene 2006 año
28.361
+1.188
4.37%
1 ene 2007 año
30.276
+1.915
6.75%
1 ene 2008 año
32.826
+2.55
8.42%
1 ene 2009 año
33.083
+0.256
0.78%
1 ene 2010 año
33.104
+0.021
0.06%
1 ene 2011 año
33.293
+0.189
0.57%
1 ene 2012 año
34.64
+1.347
4.05%
1 ene 2013 año
33.16
-1.48
-4.27%
1 ene 2014 año
33.184
+0.024
0.07%
1 ene 2015 año
33.872
+0.688
2.07%
Ranking de los países por los datos estadísticos actuales


Comentarios: