29
/es/
es
AIzaSyAYiBZKx7MnpbEhh9jyipgxe19OcubqV5w
April 1, 2024
77373
Bahrain
BHR
true
2
1
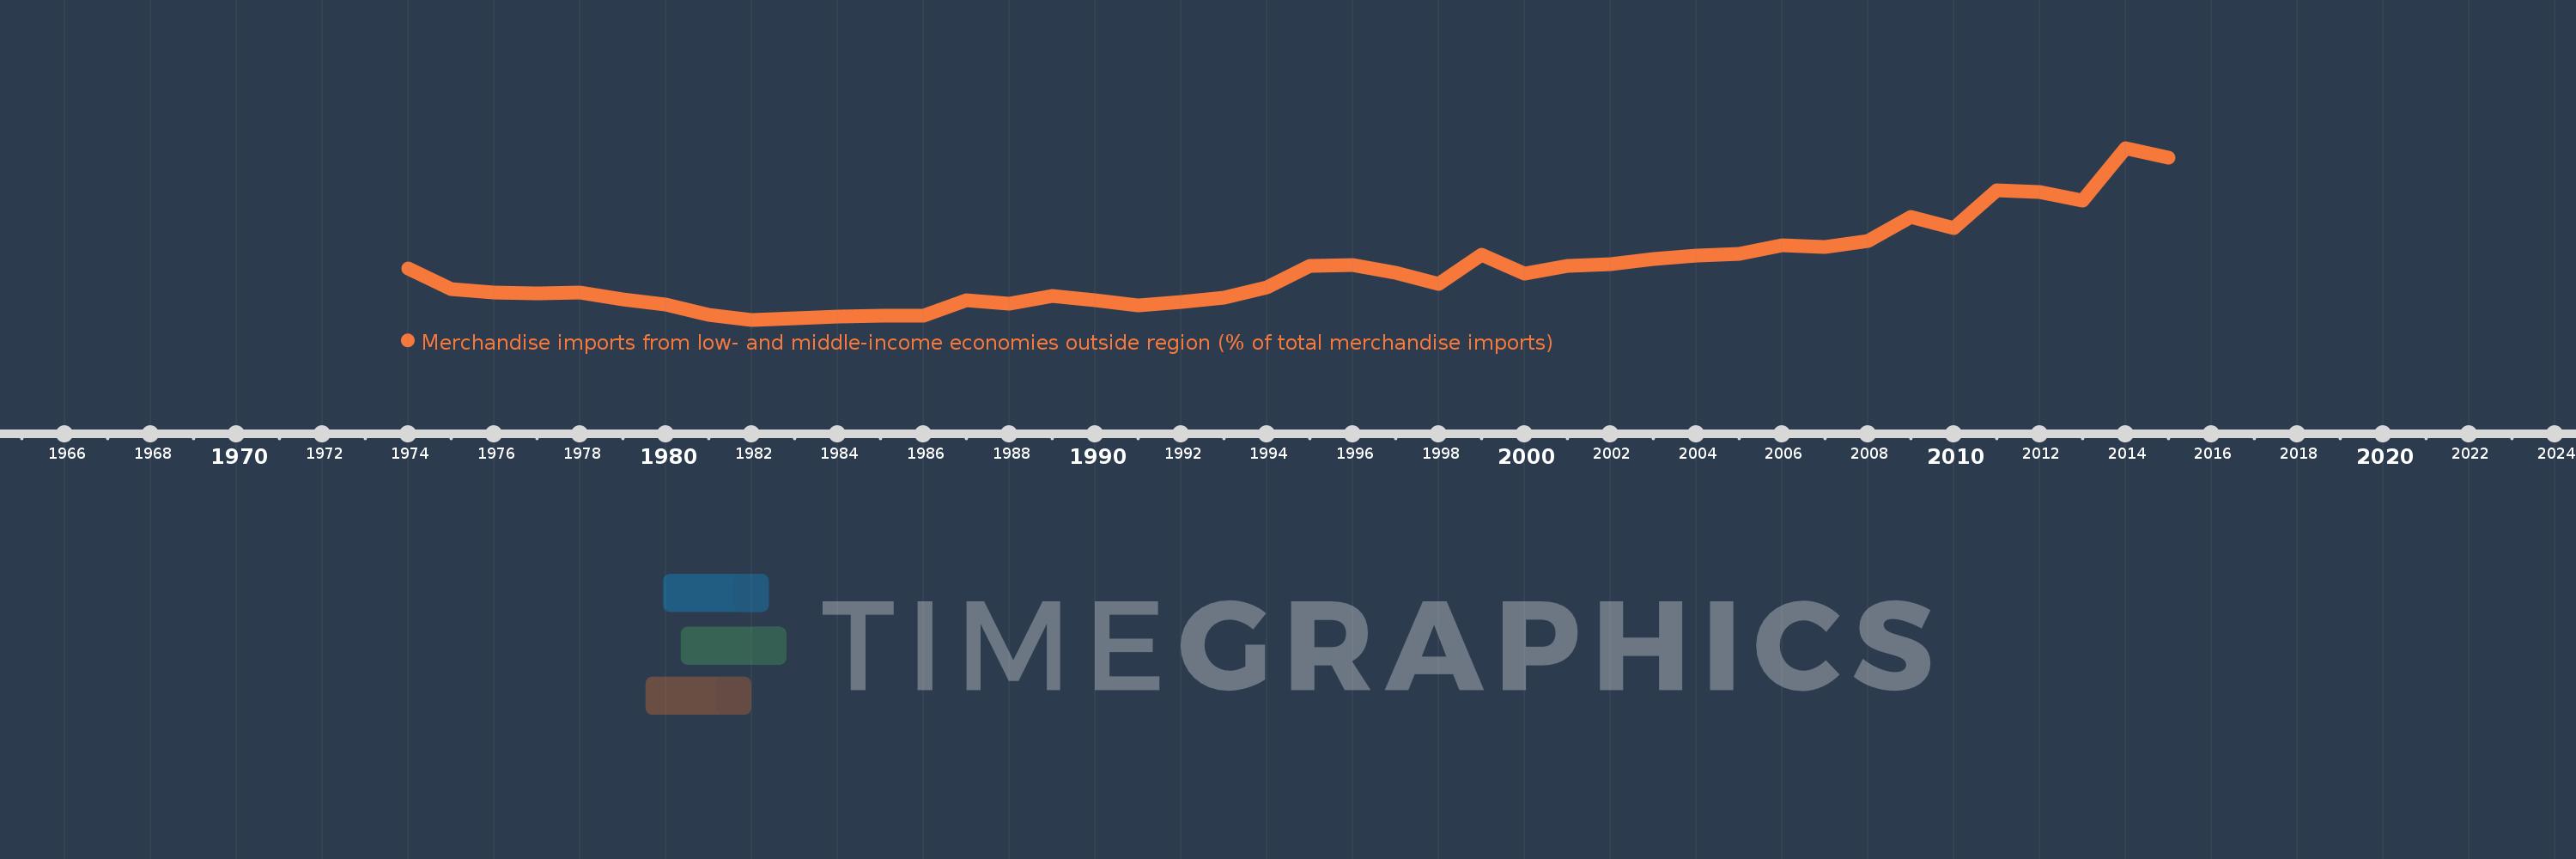
Merchandise imports from low- and middle-income economies outside region (% of total merchandise imports)
2015,2014,2013,2012,2011,2010,2009,2008,2007,2006,2005,2004,2003,2002,2001,2000,1999,1998,1997,1996,1995,1994,1993,1992,1991,1990,1989,1988,1987,1986,1985,1984,1983,1982,1981,1980,1979,1978,1977,1976,1975,1974
Estas estadísticas en otros países:
AfghanistanAlbaniaAlgeriaAngolaArab WorldArgentinaArmeniaArubaAustraliaAustriaAzerbaijanBahamas, TheBahrainBangladeshBarbadosBelarusBelgiumBelizeBeninBermudaBoliviaBrazilBrunei DarussalamBulgariaBurkina FasoBurundiCabo VerdeCambodiaCameroonCanadaCaribbean small statesCentral African RepublicCentral Europe and the BalticsChileChinaColombiaCongo, Dem. Rep.Congo, Rep.Costa RicaCote d'IvoireCroatiaCubaCyprusCzech RepublicDenmarkDominicaDominican RepublicEarly-demographic dividendEast Asia & PacificEast Asia & Pacific (excluding high income)East Asia & Pacific (IDA & IBRD countries)EcuadorEgypt, Arab Rep.El SalvadorEstoniaEthiopiaEuro areaEurope & Central AsiaEurope & Central Asia (excluding high income)Europe & Central Asia (IDA & IBRD countries)European UnionFijiFinlandFragile and conflict affected situationsFranceGabonGambia, TheGeorgiaGermanyGhanaGreeceGreenlandGrenadaGuatemalaGuineaGuyanaHaitiHeavily indebted poor countries (HIPC)High incomeHondurasHong Kong SAR, ChinaHungaryIBRD onlyIcelandIDA & IBRD totalIDA blendIDA onlyIDA totalIndiaIndonesiaIran, Islamic Rep.IraqIrelandIsraelItalyJamaicaJapanJordanKazakhstanKenyaKorea, Dem. People’s Rep.Korea, Rep.KuwaitKyrgyz RepublicLao PDRLate-demographic dividendLatin America & Caribbean Latin America & Caribbean (excluding high income)Latin America & the Caribbean (IDA & IBRD countries)LatviaLeast developed countries: UN classificationLebanonLiberiaLibyaLithuaniaLow & middle incomeLow incomeLower middle incomeLuxembourgMacao SAR, ChinaMacedonia, FYRMadagascarMalawiMalaysiaMaliMaltaMauritaniaMauritiusMexicoMiddle East & North AfricaMiddle East & North Africa (excluding high income)Middle East & North Africa (IDA & IBRD countries)Middle incomeMoldovaMongoliaMontenegroMoroccoMozambiqueMyanmarNetherlandsNew CaledoniaNew ZealandNicaraguaNigerNigeriaNorth AmericaNorwayOECD membersOmanOther small statesPacific island small statesPakistanPanamaPapua New GuineaParaguayPeruPhilippinesPolandPortugalPost-demographic dividendPre-demographic dividendQatarRomaniaRussian FederationRwandaSaudi ArabiaSenegalSerbiaSeychellesSierra LeoneSingaporeSlovak RepublicSloveniaSmall statesSomaliaSouth AfricaSouth AsiaSouth Asia (IDA & IBRD)SpainSri LankaSt. Kitts and NevisSt. LuciaSt. Vincent and the GrenadinesSub-Saharan Africa Sub-Saharan Africa (excluding high income)Sub-Saharan Africa (IDA & IBRD countries)SudanSurinameSwedenSwitzerlandSyrian Arab RepublicTanzaniaThailandTogoTrinidad and TobagoTunisiaTurkeyUgandaUkraineUnited Arab EmiratesUnited KingdomUnited StatesUpper middle incomeUruguayVenezuela, RBVietnamWorldYemen, Rep.ZambiaZimbabwe línea de tiempo (timeline):
En esta escala de tiempo se presenta un gráfico de 1974 y 2015 de Bahrain. Los datos de 1973 están ausentes. El número de observaciones reales por fecha: 42.
Fuente (nombre):
Indicadores del desarrollo mundial
Fuente (organización):
World Bank staff estimates based data from International Monetary Fund's Direction of Trade database.
Categorías:
Private Sector, Trade
Se ha actualizado:
23 abr 2017 año
Los indicadores de los cambios de valor en los últimos años
Mínimo:
2.123
1 ene 1982 año
Máximo:
33.687
1 ene 2014 año
A la fecha de observación
Valor
Cambio absoluto
El cambio con respecto al valor anterior
1 ene 1974 año
11.574
+11.574
0.0%
1 ene 1975 año
7.724
-3.85
-33.26%
1 ene 1976 año
7.166
-0.558
-7.22%
1 ene 1977 año
6.948
-0.219
-3.05%
1 ene 1978 año
7.188
+0.24
3.45%
1 ene 1979 año
5.824
-1.364
-18.97%
1 ene 1980 año
4.9
-0.924
-15.86%
1 ene 1981 año
3.071
-1.829
-37.32%
1 ene 1982 año
2.123
-0.949
-30.89%
1 ene 1983 año
2.417
+0.295
13.89%
1 ene 1984 año
2.78
+0.363
15.01%
1 ene 1985 año
2.932
+0.151
5.44%
1 ene 1986 año
2.932
+0.0
0.0%
1 ene 1987 año
5.712
+2.78
94.83%
1 ene 1988 año
5.131
-0.581
-10.18%
1 ene 1989 año
6.438
+1.308
25.49%
1 ene 1990 año
5.688
-0.75
-11.66%
1 ene 1991 año
4.728
-0.96
-16.88%
1 ene 1992 año
5.336
+0.609
12.88%
1 ene 1993 año
6.174
+0.837
15.69%
1 ene 1994 año
8.017
+1.844
29.86%
1 ene 1995 año
12.046
+4.028
50.24%
1 ene 1996 año
12.196
+0.15
1.25%
1 ene 1997 año
10.703
-1.493
-12.24%
1 ene 1998 año
8.692
-2.01
-18.78%
1 ene 1999 año
14.091
+5.399
62.11%
1 ene 2000 año
10.65
-3.441
-24.42%
1 ene 2001 año
11.965
+1.315
12.35%
1 ene 2002 año
12.288
+0.323
2.7%
1 ene 2003 año
13.343
+1.055
8.58%
1 ene 2004 año
13.878
+0.535
4.01%
1 ene 2005 año
14.202
+0.324
2.33%
1 ene 2006 año
15.802
+1.599
11.26%
1 ene 2007 año
15.567
-0.235
-1.49%
1 ene 2008 año
16.577
+1.01
6.49%
1 ene 2009 año
20.953
+4.376
26.4%
1 ene 2010 año
18.9
-2.053
-9.8%
1 ene 2011 año
25.984
+7.084
37.48%
1 ene 2012 año
25.605
-0.378
-1.46%
1 ene 2013 año
24.064
-1.541
-6.02%
1 ene 2014 año
33.687
+9.623
39.99%
1 ene 2015 año
31.905
-1.782
-5.29%
Ranking de los países por los datos estadísticos actuales


Comentarios: