29
/es/
es
AIzaSyAYiBZKx7MnpbEhh9jyipgxe19OcubqV5w
April 1, 2024
93559
Bulgaria
BGR
true
2
1
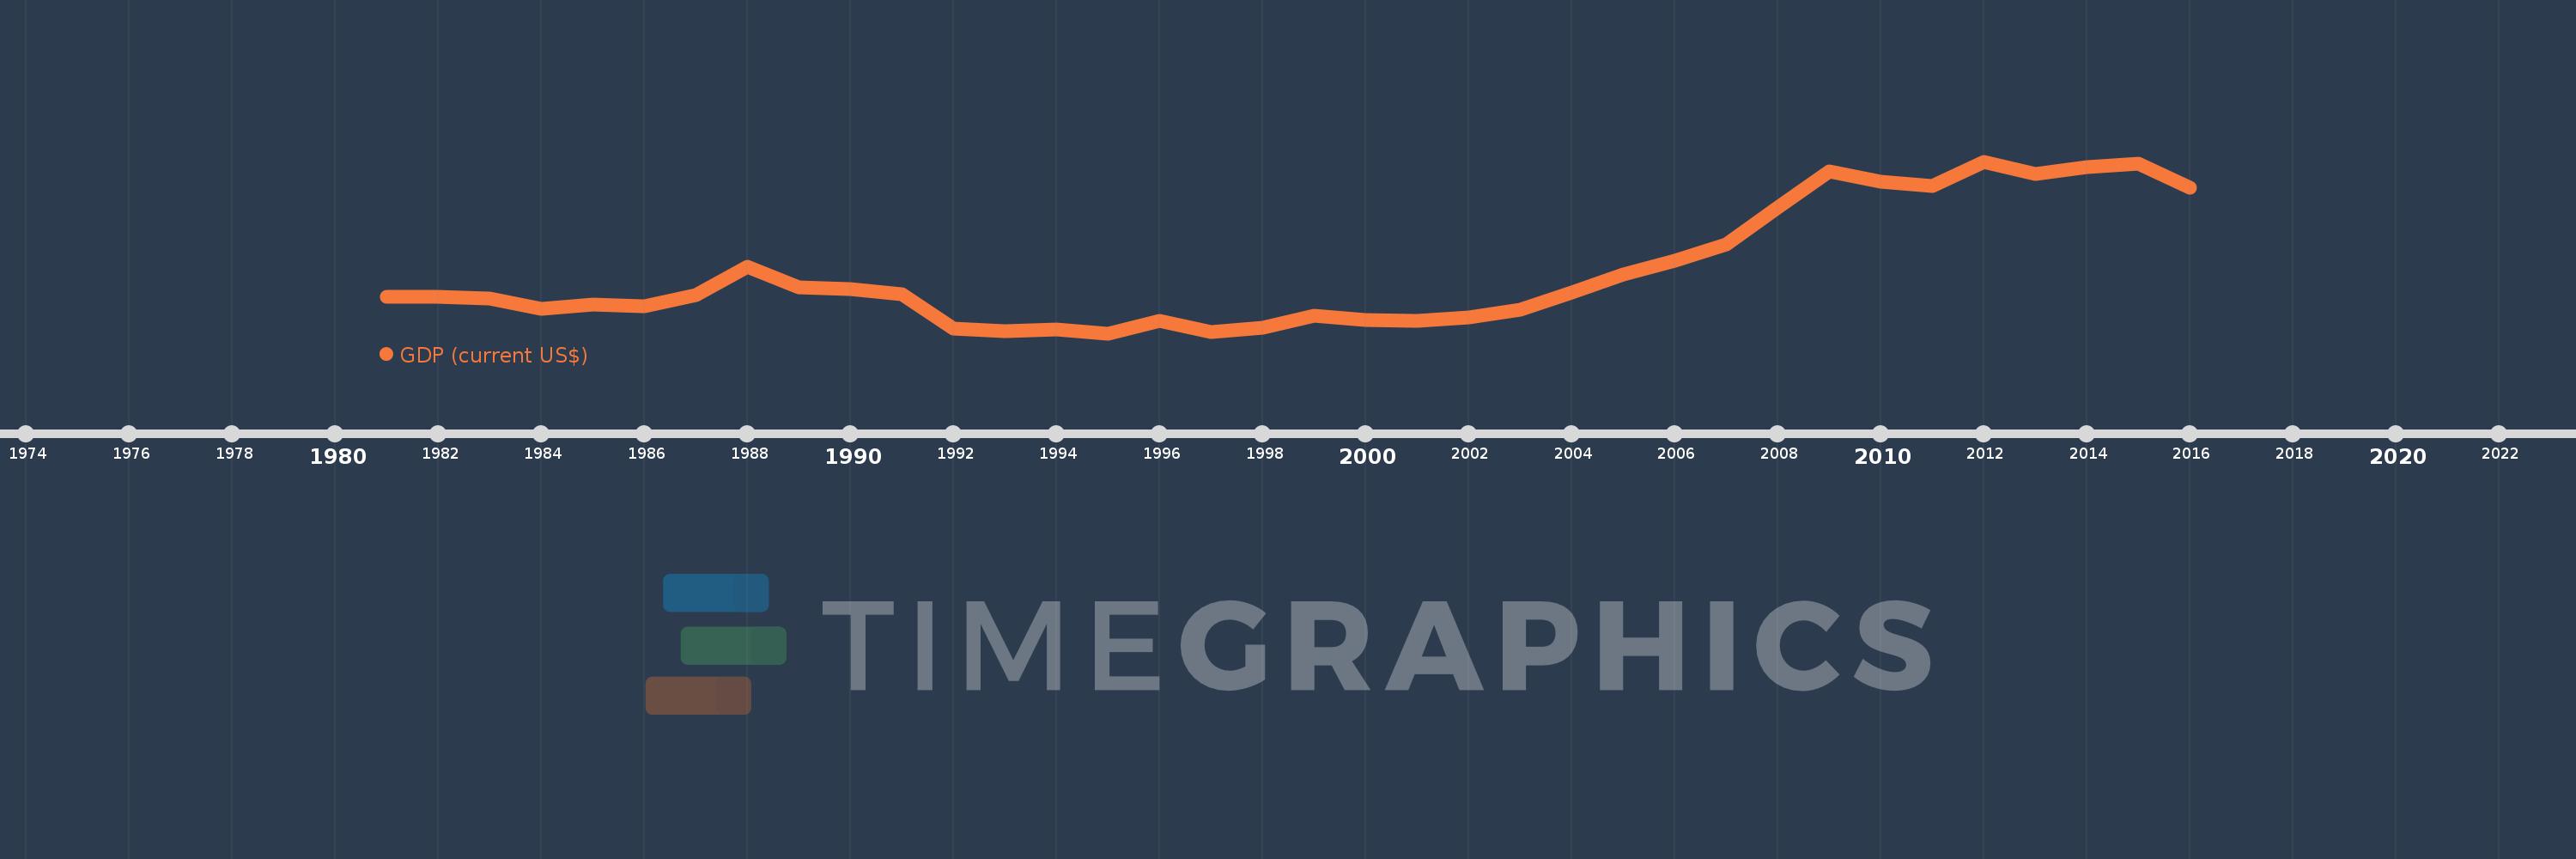
GDP (current US$)
2016,2015,2014,2013,2012,2011,2010,2009,2008,2007,2006,2005,2004,2003,2002,2001,2000,1999,1998,1997,1996,1995,1994,1993,1992,1991,1990,1989,1988,1987,1986,1985,1984,1983,1982,1981
Estas estadísticas en otros países:
AfghanistanAlbaniaAlgeriaAndorraAngolaAntigua and BarbudaArab WorldArgentinaArmeniaArubaAustraliaAustriaAzerbaijanBahamas, TheBahrainBangladeshBarbadosBelarusBelgiumBelizeBeninBermudaBhutanBoliviaBosnia and HerzegovinaBotswanaBrazilBrunei DarussalamBulgariaBurkina FasoBurundiCabo VerdeCambodiaCameroonCanadaCaribbean small statesCayman IslandsCentral African RepublicCentral Europe and the BalticsChadChannel IslandsChileChinaColombiaComorosCongo, Dem. Rep.Congo, Rep.Costa RicaCote d'IvoireCroatiaCubaCyprusCzech RepublicDenmarkDjiboutiDominicaDominican RepublicEarly-demographic dividendEast Asia & PacificEast Asia & Pacific (excluding high income)East Asia & Pacific (IDA & IBRD countries)EcuadorEgypt, Arab Rep.El SalvadorEquatorial GuineaEritreaEstoniaEthiopiaEuro areaEurope & Central AsiaEurope & Central Asia (excluding high income)Europe & Central Asia (IDA & IBRD countries)European UnionFaroe IslandsFijiFinlandFragile and conflict affected situationsFranceFrench PolynesiaGabonGambia, TheGeorgiaGermanyGhanaGreeceGreenlandGrenadaGuatemalaGuineaGuinea-BissauGuyanaHaitiHeavily indebted poor countries (HIPC)High incomeHondurasHong Kong SAR, ChinaHungaryIBRD onlyIcelandIDA & IBRD totalIDA blendIDA onlyIDA totalIndiaIndonesiaIran, Islamic Rep.IraqIrelandIsle of ManIsraelItalyJamaicaJapanJordanKazakhstanKenyaKiribatiKorea, Rep.KosovoKuwaitKyrgyz RepublicLao PDRLate-demographic dividendLatin America & Caribbean Latin America & Caribbean (excluding high income)Latin America & the Caribbean (IDA & IBRD countries)LatviaLeast developed countries: UN classificationLebanonLesothoLiberiaLibyaLiechtensteinLithuaniaLow & middle incomeLow incomeLower middle incomeLuxembourgMacao SAR, ChinaMacedonia, FYRMadagascarMalawiMalaysiaMaldivesMaliMaltaMarshall IslandsMauritaniaMauritiusMexicoMicronesia, Fed. Sts.Middle East & North AfricaMiddle East & North Africa (excluding high income)Middle East & North Africa (IDA & IBRD countries)Middle incomeMoldovaMonacoMongoliaMontenegroMoroccoMozambiqueMyanmarNamibiaNauruNepalNetherlandsNew CaledoniaNew ZealandNicaraguaNigerNigeriaNorth AmericaNorwayOECD membersOmanOther small statesPacific island small statesPakistanPalauPanamaPapua New GuineaParaguayPeruPhilippinesPolandPortugalPost-demographic dividendPre-demographic dividendPuerto RicoQatarRomaniaRussian FederationRwandaSamoaSan MarinoSao Tome and PrincipeSaudi ArabiaSenegalSerbiaSeychellesSierra LeoneSingaporeSlovak RepublicSloveniaSmall statesSolomon IslandsSomaliaSouth AfricaSouth AsiaSouth Asia (IDA & IBRD)South SudanSpainSri LankaSt. Kitts and NevisSt. LuciaSt. Vincent and the GrenadinesSub-Saharan Africa Sub-Saharan Africa (excluding high income)Sub-Saharan Africa (IDA & IBRD countries)SudanSurinameSwazilandSwedenSwitzerlandSyrian Arab RepublicTajikistanTanzaniaThailandTimor-LesteTogoTongaTrinidad and TobagoTunisiaTurkeyTurkmenistanTuvaluUgandaUkraineUnited Arab EmiratesUnited KingdomUnited StatesUpper middle incomeUruguayUzbekistanVanuatuVenezuela, RBVietnamVirgin Islands (U.S.)West Bank and GazaWorldYemen, Rep.ZambiaZimbabwe línea de tiempo (timeline):
En esta escala de tiempo se presenta un gráfico de 1981 y 2016 de Bulgaria. Los datos de 1980 están ausentes. El número de observaciones reales por fecha: 36.
Fuente (nombre):
Indicadores del desarrollo mundial
Fuente (organización):
World Bank national accounts data, and OECD National Accounts data files.
Categorías:
Economy & Growth
Se ha actualizado:
23 abr 2017 año
Los indicadores de los cambios de valor en los últimos años
Mínimo:
9.697 bn
1 ene 1995 año
Máximo:
57.418 bn
1 ene 2012 año
A la fecha de observación
Valor
Cambio absoluto
El cambio con respecto al valor anterior
1 ene 1981 año
19.839 bn
+19.839 bn
0.0%
1 ene 1982 año
19.87 bn
+30.769 millones
0.16%
1 ene 1983 año
19.342 bn
-528.0 millones
-2.66%
1 ene 1984 año
16.564 bn
-2.778 bn
-14.36%
1 ene 1985 año
17.595 bn
+1.031 bn
6.23%
1 ene 1986 año
17.155 bn
-439.523 millones
-2.5%
1 ene 1987 año
20.249 bn
+3.094 bn
18.03%
1 ene 1988 año
28.101 bn
+7.852 bn
38.78%
1 ene 1989 año
22.556 bn
-5.545 bn
-19.73%
1 ene 1990 año
21.988 bn
-567.497 millones
-2.52%
1 ene 1991 año
20.632 bn
-1.356 bn
-6.17%
1 ene 1992 año
10.944 bn
-9.689 bn
-46.96%
1 ene 1993 año
10.351 bn
-593.033 millones
-5.42%
1 ene 1994 año
10.83 bn
+479.195 millones
4.63%
1 ene 1995 año
9.697 bn
-1.132 bn
-10.46%
1 ene 1996 año
13.063 bn
+3.366 bn
34.71%
1 ene 1997 año
10.109 bn
-2.954 bn
-22.61%
1 ene 1998 año
11.196 bn
+1.086 bn
10.74%
1 ene 1999 año
14.631 bn
+3.435 bn
30.68%
1 ene 2000 año
13.495 bn
-1.136 bn
-7.76%
1 ene 2001 año
13.148 bn
-346.964 millones
-2.57%
1 ene 2002 año
14.135 bn
+987.295 millones
7.51%
1 ene 2003 año
16.36 bn
+2.225 bn
15.74%
1 ene 2004 año
21.075 bn
+4.714 bn
28.82%
1 ene 2005 año
26.095 bn
+5.02 bn
23.82%
1 ene 2006 año
29.822 bn
+3.727 bn
14.28%
1 ene 2007 año
34.304 bn
+4.483 bn
15.03%
1 ene 2008 año
44.766 bn
+10.461 bn
30.5%
1 ene 2009 año
54.667 bn
+9.901 bn
22.12%
1 ene 2010 año
51.783 bn
-2.883 bn
-5.27%
1 ene 2011 año
50.61 bn
-1.173 bn
-2.27%
1 ene 2012 año
57.418 bn
+6.808 bn
13.45%
1 ene 2013 año
53.903 bn
-3.515 bn
-6.12%
1 ene 2014 año
55.759 bn
+1.856 bn
3.44%
1 ene 2015 año
56.732 bn
+973.262 millones
1.75%
1 ene 2016 año
50.199 bn
-6.533 bn
-11.52%
Ranking de los países por los datos estadísticos actuales


Comentarios: