29
/es/
es
AIzaSyAYiBZKx7MnpbEhh9jyipgxe19OcubqV5w
April 1, 2024
195543
Mexico
MEX
true
2
1
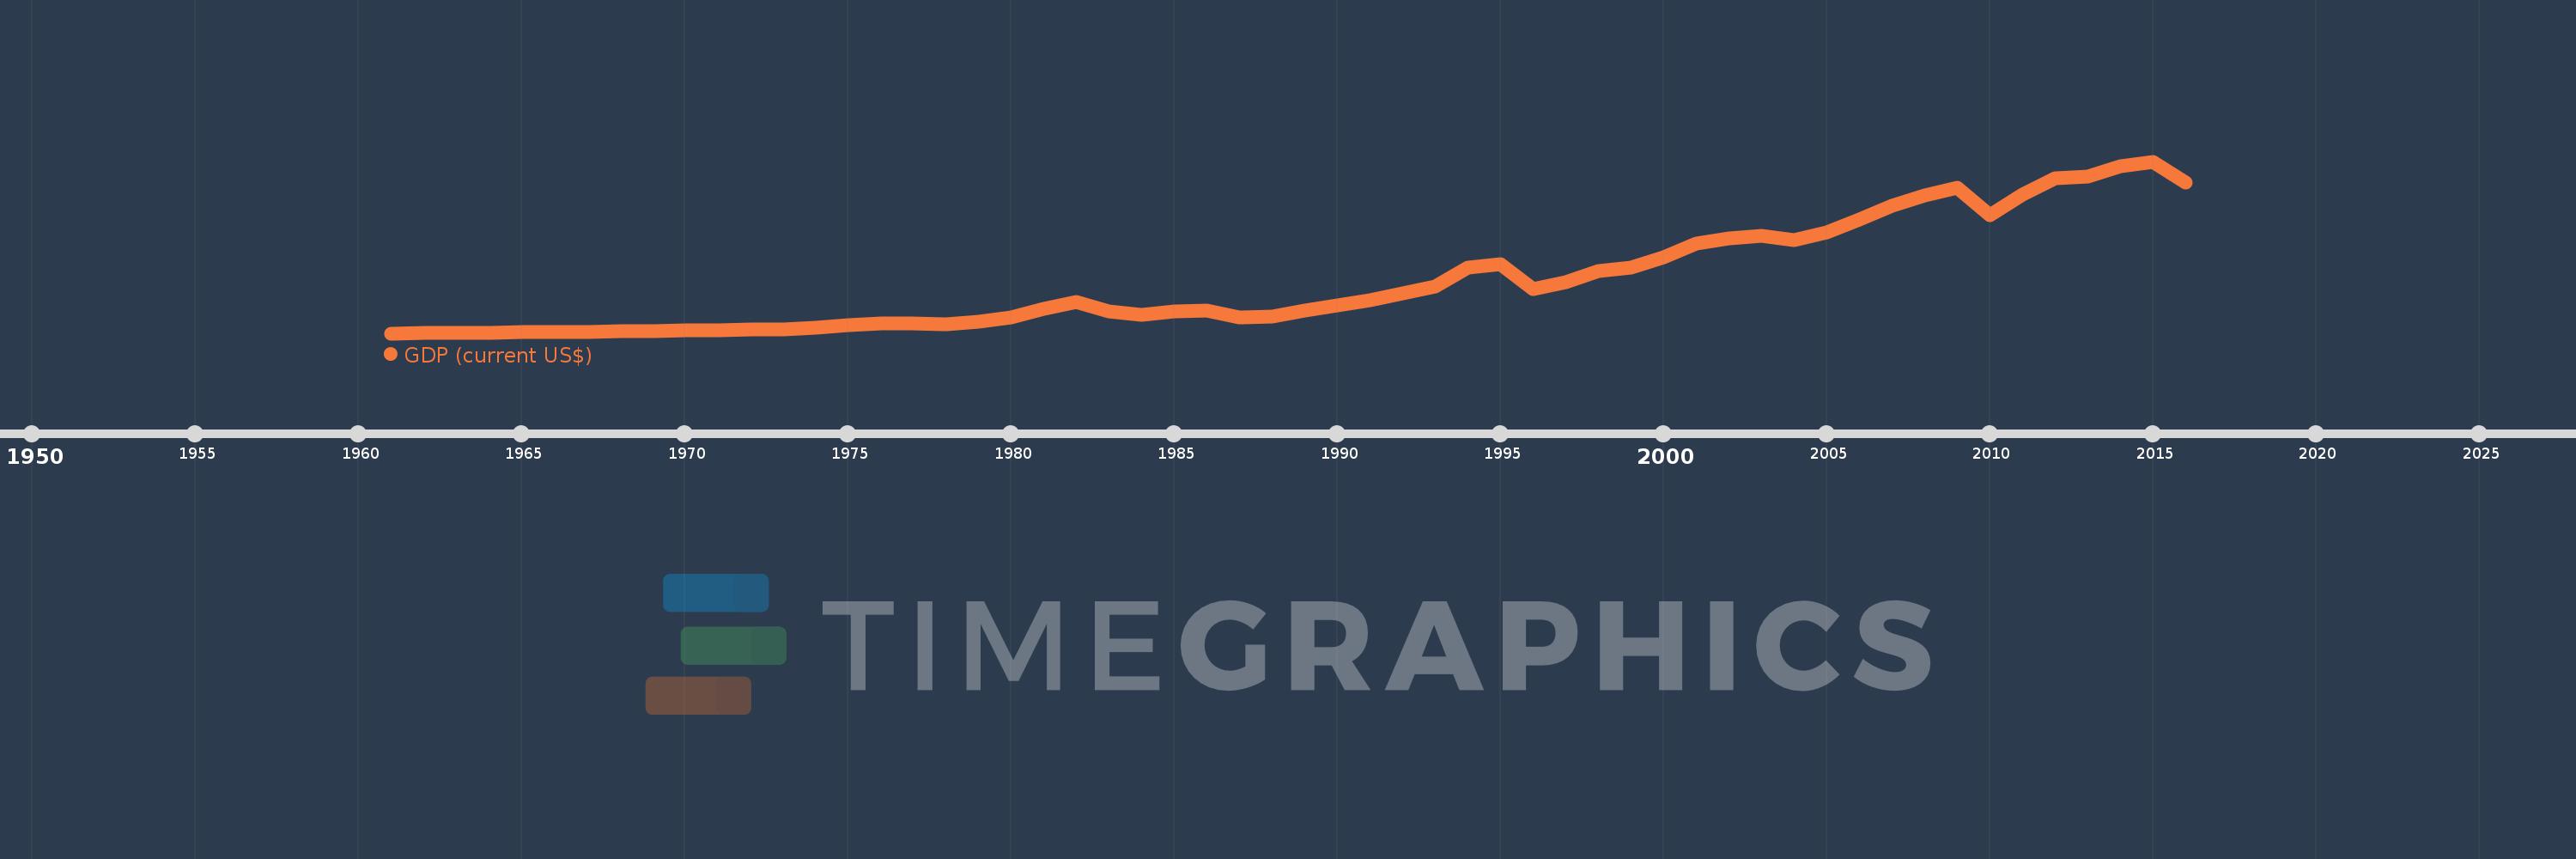
GDP (current US$)
2016,2015,2014,2013,2012,2011,2010,2009,2008,2007,2006,2005,2004,2003,2002,2001,2000,1999,1998,1997,1996,1995,1994,1993,1992,1991,1990,1989,1988,1987,1986,1985,1984,1983,1982,1981,1980,1979,1978,1977,1976,1975,1974,1973,1972,1971,1970,1969,1968,1967,1966,1965,1964,1963,1962,1961
Estas estadísticas en otros países:
AfghanistanAlbaniaAlgeriaAndorraAngolaAntigua and BarbudaArab WorldArgentinaArmeniaArubaAustraliaAustriaAzerbaijanBahamas, TheBahrainBangladeshBarbadosBelarusBelgiumBelizeBeninBermudaBhutanBoliviaBosnia and HerzegovinaBotswanaBrazilBrunei DarussalamBulgariaBurkina FasoBurundiCabo VerdeCambodiaCameroonCanadaCaribbean small statesCayman IslandsCentral African RepublicCentral Europe and the BalticsChadChannel IslandsChileChinaColombiaComorosCongo, Dem. Rep.Congo, Rep.Costa RicaCote d'IvoireCroatiaCubaCyprusCzech RepublicDenmarkDjiboutiDominicaDominican RepublicEarly-demographic dividendEast Asia & PacificEast Asia & Pacific (excluding high income)East Asia & Pacific (IDA & IBRD countries)EcuadorEgypt, Arab Rep.El SalvadorEquatorial GuineaEritreaEstoniaEthiopiaEuro areaEurope & Central AsiaEurope & Central Asia (excluding high income)Europe & Central Asia (IDA & IBRD countries)European UnionFaroe IslandsFijiFinlandFragile and conflict affected situationsFranceFrench PolynesiaGabonGambia, TheGeorgiaGermanyGhanaGreeceGreenlandGrenadaGuatemalaGuineaGuinea-BissauGuyanaHaitiHeavily indebted poor countries (HIPC)High incomeHondurasHong Kong SAR, ChinaHungaryIBRD onlyIcelandIDA & IBRD totalIDA blendIDA onlyIDA totalIndiaIndonesiaIran, Islamic Rep.IraqIrelandIsle of ManIsraelItalyJamaicaJapanJordanKazakhstanKenyaKiribatiKorea, Rep.KosovoKuwaitKyrgyz RepublicLao PDRLate-demographic dividendLatin America & Caribbean Latin America & Caribbean (excluding high income)Latin America & the Caribbean (IDA & IBRD countries)LatviaLeast developed countries: UN classificationLebanonLesothoLiberiaLibyaLiechtensteinLithuaniaLow & middle incomeLow incomeLower middle incomeLuxembourgMacao SAR, ChinaMacedonia, FYRMadagascarMalawiMalaysiaMaldivesMaliMaltaMarshall IslandsMauritaniaMauritiusMexicoMicronesia, Fed. Sts.Middle East & North AfricaMiddle East & North Africa (excluding high income)Middle East & North Africa (IDA & IBRD countries)Middle incomeMoldovaMonacoMongoliaMontenegroMoroccoMozambiqueMyanmarNamibiaNauruNepalNetherlandsNew CaledoniaNew ZealandNicaraguaNigerNigeriaNorth AmericaNorwayOECD membersOmanOther small statesPacific island small statesPakistanPalauPanamaPapua New GuineaParaguayPeruPhilippinesPolandPortugalPost-demographic dividendPre-demographic dividendPuerto RicoQatarRomaniaRussian FederationRwandaSamoaSan MarinoSao Tome and PrincipeSaudi ArabiaSenegalSerbiaSeychellesSierra LeoneSingaporeSlovak RepublicSloveniaSmall statesSolomon IslandsSomaliaSouth AfricaSouth AsiaSouth Asia (IDA & IBRD)South SudanSpainSri LankaSt. Kitts and NevisSt. LuciaSt. Vincent and the GrenadinesSub-Saharan Africa Sub-Saharan Africa (excluding high income)Sub-Saharan Africa (IDA & IBRD countries)SudanSurinameSwazilandSwedenSwitzerlandSyrian Arab RepublicTajikistanTanzaniaThailandTimor-LesteTogoTongaTrinidad and TobagoTunisiaTurkeyTurkmenistanTuvaluUgandaUkraineUnited Arab EmiratesUnited KingdomUnited StatesUpper middle incomeUruguayUzbekistanVanuatuVenezuela, RBVietnamVirgin Islands (U.S.)West Bank and GazaWorldYemen, Rep.ZambiaZimbabwe línea de tiempo (timeline):
En esta escala de tiempo se presenta un gráfico de 1961 y 2016 de Mexico. Los datos de 1960 están ausentes. El número de observaciones reales por fecha: 56.
Fuente (nombre):
Indicadores del desarrollo mundial
Fuente (organización):
World Bank national accounts data, and OECD National Accounts data files.
Categorías:
Economy & Growth
Se ha actualizado:
23 abr 2017 año
Los indicadores de los cambios de valor en los últimos años
Mínimo:
13.056 bn
1 ene 1961 año
Máximo:
1.298 billones
1 ene 2015 año
A la fecha de observación
Valor
Cambio absoluto
El cambio con respecto al valor anterior
1 ene 1961 año
13.056 bn
+13.056 bn
0.0%
1 ene 1962 año
14.154 bn
+1.098 bn
8.41%
1 ene 1963 año
15.221 bn
+1.067 bn
7.54%
1 ene 1964 año
16.936 bn
+1.715 bn
11.27%
1 ene 1965 año
20.07 bn
+3.134 bn
18.5%
1 ene 1966 año
21.83 bn
+1.76 bn
8.77%
1 ene 1967 año
24.337 bn
+2.508 bn
11.49%
1 ene 1968 año
26.556 bn
+2.219 bn
9.12%
1 ene 1969 año
29.364 bn
+2.807 bn
10.57%
1 ene 1970 año
32.516 bn
+3.152 bn
10.73%
1 ene 1971 año
35.542 bn
+3.026 bn
9.31%
1 ene 1972 año
39.201 bn
+3.659 bn
10.3%
1 ene 1973 año
45.178 bn
+5.977 bn
15.25%
1 ene 1974 año
55.271 bn
+10.093 bn
22.34%
1 ene 1975 año
71.977 bn
+16.705 bn
30.22%
1 ene 1976 año
88.004 bn
+16.027 bn
22.27%
1 ene 1977 año
89.024 bn
+1.02 bn
1.16%
1 ene 1978 año
81.826 bn
-7.198 bn
-8.09%
1 ene 1979 año
102.517 bn
+20.692 bn
25.29%
1 ene 1980 año
134.54 bn
+32.023 bn
31.24%
1 ene 1981 año
194.357 bn
+59.817 bn
44.46%
1 ene 1982 año
250.083 bn
+55.726 bn
28.67%
1 ene 1983 año
173.721 bn
-76.362 bn
-30.53%
1 ene 1984 año
148.867 bn
-24.854 bn
-14.31%
1 ene 1985 año
175.632 bn
+26.765 bn
17.98%
1 ene 1986 año
184.473 bn
+8.841 bn
5.03%
1 ene 1987 año
129.44 bn
-55.033 bn
-29.83%
1 ene 1988 año
140.264 bn
+10.823 bn
8.36%
1 ene 1989 año
183.144 bn
+42.881 bn
30.57%
1 ene 1990 año
222.977 bn
+39.833 bn
21.75%
1 ene 1991 año
262.71 bn
+39.733 bn
17.82%
1 ene 1992 año
314.454 bn
+51.744 bn
19.7%
1 ene 1993 año
363.609 bn
+49.155 bn
15.63%
1 ene 1994 año
503.963 bn
+140.354 bn
38.6%
1 ene 1995 año
527.319 bn
+23.356 bn
4.63%
1 ene 1996 año
343.793 bn
-183.526 bn
-34.8%
1 ene 1997 año
397.404 bn
+53.611 bn
15.59%
1 ene 1998 año
480.555 bn
+83.151 bn
20.92%
1 ene 1999 año
502.01 bn
+21.456 bn
4.46%
1 ene 2000 año
579.46 bn
+77.449 bn
15.43%
1 ene 2001 año
683.648 bn
+104.188 bn
17.98%
1 ene 2002 año
724.704 bn
+41.056 bn
6.01%
1 ene 2003 año
741.56 bn
+16.856 bn
2.33%
1 ene 2004 año
713.284 bn
-28.275 bn
-3.81%
1 ene 2005 año
770.268 bn
+56.983 bn
7.99%
1 ene 2006 año
866.346 bn
+96.078 bn
12.47%
1 ene 2007 año
965.281 bn
+98.935 bn
11.42%
1 ene 2008 año
1.043 billones
+78.19 bn
8.1%
1 ene 2009 año
1.101 billones
+57.804 bn
5.54%
1 ene 2010 año
894.949 bn
-206.327 bn
-18.74%
1 ene 2011 año
1.051 billones
+156.18 bn
17.45%
1 ene 2012 año
1.171 billones
+120.059 bn
11.42%
1 ene 2013 año
1.187 billones
+15.411 bn
1.32%
1 ene 2014 año
1.262 billones
+75.383 bn
6.35%
1 ene 2015 año
1.298 billones
+36.194 bn
2.87%
1 ene 2016 año
1.144 billones
-154.383 bn
-11.89%
Ranking de los países por los datos estadísticos actuales


Comentarios: