29
/es/
es
AIzaSyAYiBZKx7MnpbEhh9jyipgxe19OcubqV5w
April 1, 2024
118903
Denmark
DNK
true
2
1
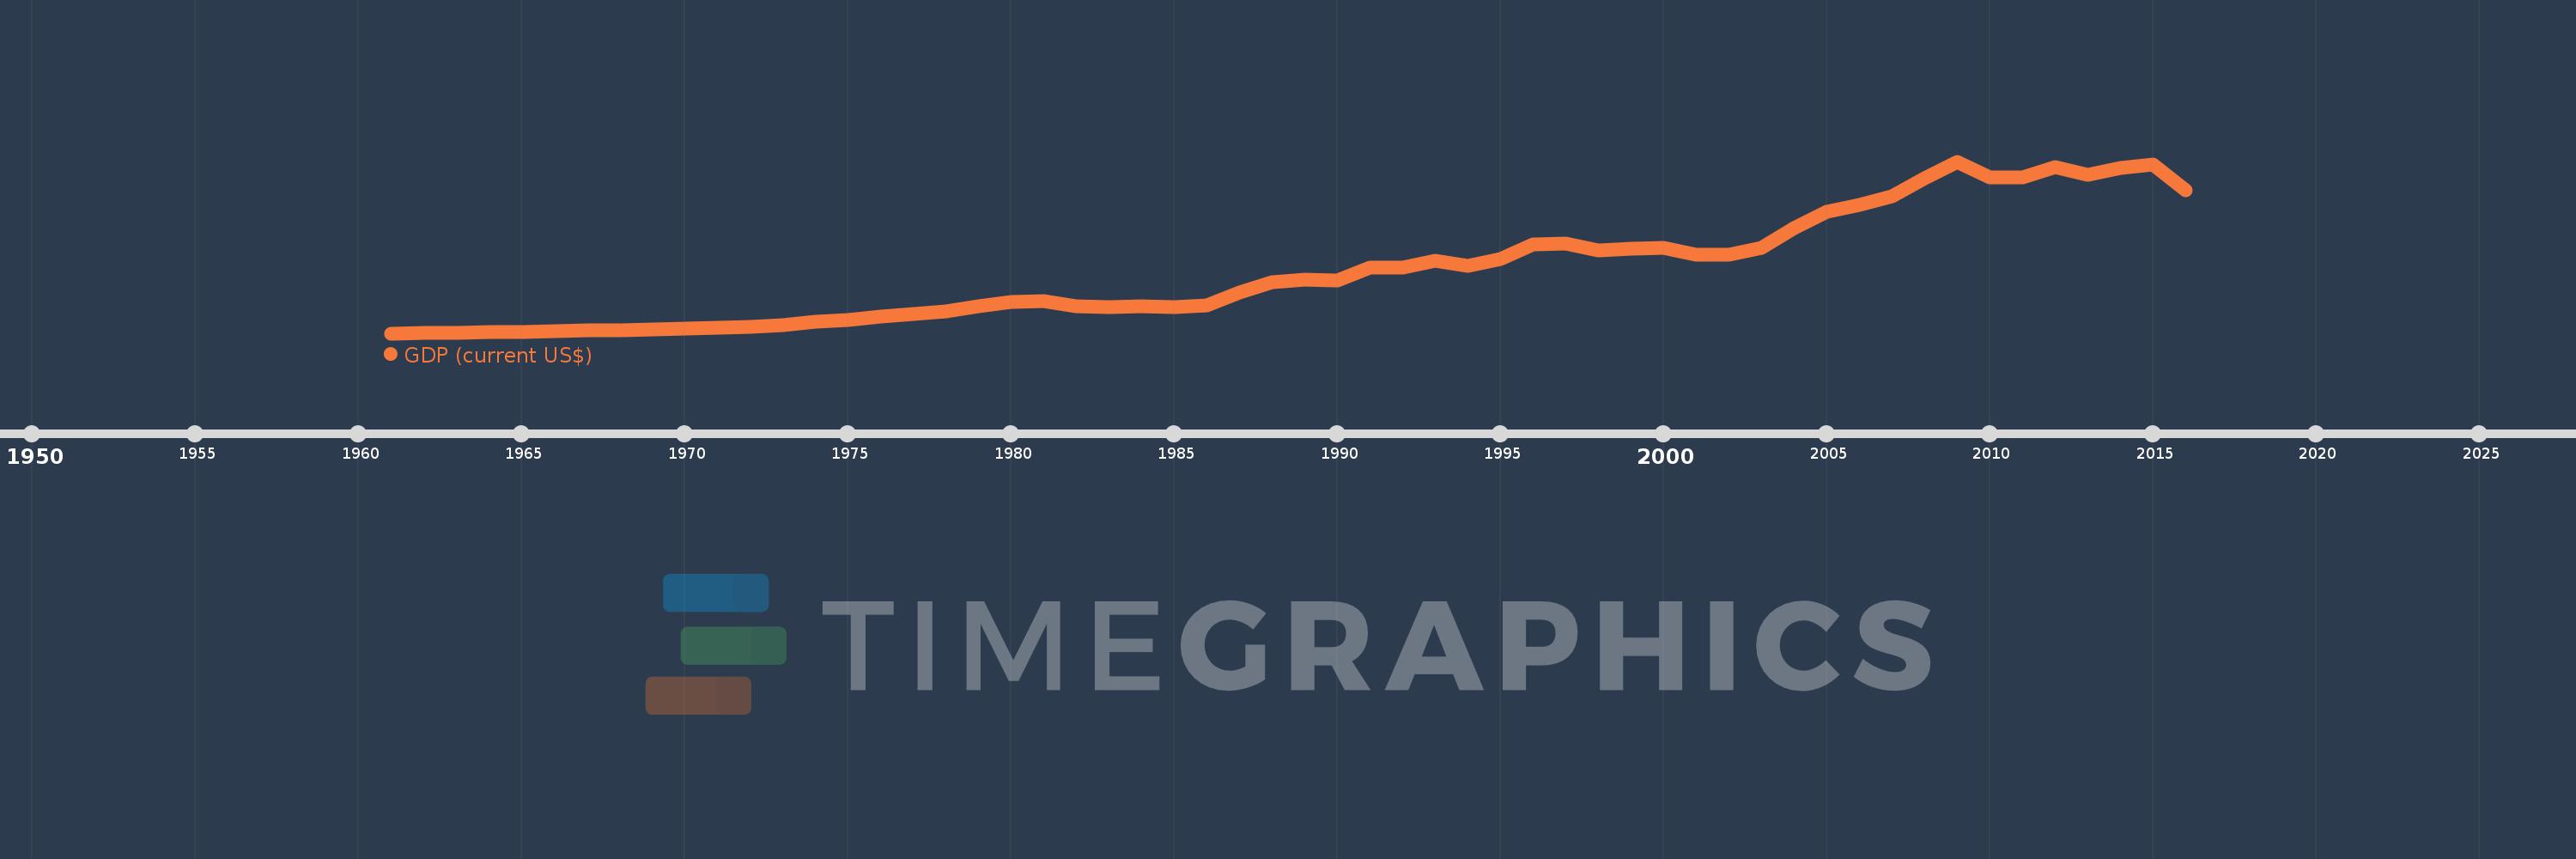
GDP (current US$)
2016,2015,2014,2013,2012,2011,2010,2009,2008,2007,2006,2005,2004,2003,2002,2001,2000,1999,1998,1997,1996,1995,1994,1993,1992,1991,1990,1989,1988,1987,1986,1985,1984,1983,1982,1981,1980,1979,1978,1977,1976,1975,1974,1973,1972,1971,1970,1969,1968,1967,1966,1965,1964,1963,1962,1961
Estas estadísticas en otros países:
AfghanistanAlbaniaAlgeriaAndorraAngolaAntigua and BarbudaArab WorldArgentinaArmeniaArubaAustraliaAustriaAzerbaijanBahamas, TheBahrainBangladeshBarbadosBelarusBelgiumBelizeBeninBermudaBhutanBoliviaBosnia and HerzegovinaBotswanaBrazilBrunei DarussalamBulgariaBurkina FasoBurundiCabo VerdeCambodiaCameroonCanadaCaribbean small statesCayman IslandsCentral African RepublicCentral Europe and the BalticsChadChannel IslandsChileChinaColombiaComorosCongo, Dem. Rep.Congo, Rep.Costa RicaCote d'IvoireCroatiaCubaCyprusCzech RepublicDenmarkDjiboutiDominicaDominican RepublicEarly-demographic dividendEast Asia & PacificEast Asia & Pacific (excluding high income)East Asia & Pacific (IDA & IBRD countries)EcuadorEgypt, Arab Rep.El SalvadorEquatorial GuineaEritreaEstoniaEthiopiaEuro areaEurope & Central AsiaEurope & Central Asia (excluding high income)Europe & Central Asia (IDA & IBRD countries)European UnionFaroe IslandsFijiFinlandFragile and conflict affected situationsFranceFrench PolynesiaGabonGambia, TheGeorgiaGermanyGhanaGreeceGreenlandGrenadaGuatemalaGuineaGuinea-BissauGuyanaHaitiHeavily indebted poor countries (HIPC)High incomeHondurasHong Kong SAR, ChinaHungaryIBRD onlyIcelandIDA & IBRD totalIDA blendIDA onlyIDA totalIndiaIndonesiaIran, Islamic Rep.IraqIrelandIsle of ManIsraelItalyJamaicaJapanJordanKazakhstanKenyaKiribatiKorea, Rep.KosovoKuwaitKyrgyz RepublicLao PDRLate-demographic dividendLatin America & Caribbean Latin America & Caribbean (excluding high income)Latin America & the Caribbean (IDA & IBRD countries)LatviaLeast developed countries: UN classificationLebanonLesothoLiberiaLibyaLiechtensteinLithuaniaLow & middle incomeLow incomeLower middle incomeLuxembourgMacao SAR, ChinaMacedonia, FYRMadagascarMalawiMalaysiaMaldivesMaliMaltaMarshall IslandsMauritaniaMauritiusMexicoMicronesia, Fed. Sts.Middle East & North AfricaMiddle East & North Africa (excluding high income)Middle East & North Africa (IDA & IBRD countries)Middle incomeMoldovaMonacoMongoliaMontenegroMoroccoMozambiqueMyanmarNamibiaNauruNepalNetherlandsNew CaledoniaNew ZealandNicaraguaNigerNigeriaNorth AmericaNorwayOECD membersOmanOther small statesPacific island small statesPakistanPalauPanamaPapua New GuineaParaguayPeruPhilippinesPolandPortugalPost-demographic dividendPre-demographic dividendPuerto RicoQatarRomaniaRussian FederationRwandaSamoaSan MarinoSao Tome and PrincipeSaudi ArabiaSenegalSerbiaSeychellesSierra LeoneSingaporeSlovak RepublicSloveniaSmall statesSolomon IslandsSomaliaSouth AfricaSouth AsiaSouth Asia (IDA & IBRD)South SudanSpainSri LankaSt. Kitts and NevisSt. LuciaSt. Vincent and the GrenadinesSub-Saharan Africa Sub-Saharan Africa (excluding high income)Sub-Saharan Africa (IDA & IBRD countries)SudanSurinameSwazilandSwedenSwitzerlandSyrian Arab RepublicTajikistanTanzaniaThailandTimor-LesteTogoTongaTrinidad and TobagoTunisiaTurkeyTurkmenistanTuvaluUgandaUkraineUnited Arab EmiratesUnited KingdomUnited StatesUpper middle incomeUruguayUzbekistanVanuatuVenezuela, RBVietnamVirgin Islands (U.S.)West Bank and GazaWorldYemen, Rep.ZambiaZimbabwe línea de tiempo (timeline):
En esta escala de tiempo se presenta un gráfico de 1961 y 2016 de Denmark. Los datos de 1960 están ausentes. El número de observaciones reales por fecha: 56.
Fuente (nombre):
Indicadores del desarrollo mundial
Fuente (organización):
World Bank national accounts data, and OECD National Accounts data files.
Categorías:
Economy & Growth
Se ha actualizado:
23 abr 2017 año
Los indicadores de los cambios de valor en los últimos años
Mínimo:
6.249 bn
1 ene 1961 año
Máximo:
352.592 bn
1 ene 2009 año
A la fecha de observación
Valor
Cambio absoluto
El cambio con respecto al valor anterior
1 ene 1961 año
6.249 bn
+6.249 bn
0.0%
1 ene 1962 año
6.934 bn
+684.895 millones
10.96%
1 ene 1963 año
7.813 bn
+879.126 millones
12.68%
1 ene 1964 año
8.317 bn
+503.724 millones
6.45%
1 ene 1965 año
9.507 bn
+1.19 bn
14.31%
1 ene 1966 año
10.679 bn
+1.172 bn
12.33%
1 ene 1967 año
11.721 bn
+1.042 bn
9.76%
1 ene 1968 año
12.788 bn
+1.067 bn
9.11%
1 ene 1969 año
13.197 bn
+408.062 millones
3.19%
1 ene 1970 año
15.009 bn
+1.813 bn
13.74%
1 ene 1971 año
16.866 bn
+1.857 bn
12.37%
1 ene 1972 año
18.823 bn
+1.957 bn
11.6%
1 ene 1973 año
22.966 bn
+4.143 bn
22.01%
1 ene 1974 año
30.46 bn
+7.493 bn
32.63%
1 ene 1975 año
33.901 bn
+3.441 bn
11.3%
1 ene 1976 año
40.251 bn
+6.351 bn
18.73%
1 ene 1977 año
44.402 bn
+4.151 bn
10.31%
1 ene 1978 año
49.666 bn
+5.265 bn
11.86%
1 ene 1979 año
60.281 bn
+10.615 bn
21.37%
1 ene 1980 año
70.31 bn
+10.028 bn
16.64%
1 ene 1981 año
70.867 bn
+557.671 millones
0.79%
1 ene 1982 año
61.377 bn
-9.49 bn
-13.39%
1 ene 1983 año
59.916 bn
-1.461 bn
-2.38%
1 ene 1984 año
60.188 bn
+272.097 millones
0.45%
1 ene 1985 año
58.673 bn
-1.515 bn
-2.52%
1 ene 1986 año
62.221 bn
+3.547 bn
6.05%
1 ene 1987 año
87.8 bn
+25.58 bn
41.11%
1 ene 1988 año
109.15 bn
+21.35 bn
24.32%
1 ene 1989 año
115.112 bn
+5.962 bn
5.46%
1 ene 1990 año
111.887 bn
-3.225 bn
-2.8%
1 ene 1991 año
138.095 bn
+26.208 bn
23.42%
1 ene 1992 año
138.965 bn
+870.037 millones
0.63%
1 ene 1993 año
152.691 bn
+13.726 bn
9.88%
1 ene 1994 año
142.963 bn
-9.728 bn
-6.37%
1 ene 1995 año
156.145 bn
+13.182 bn
9.22%
1 ene 1996 año
185.007 bn
+28.862 bn
18.48%
1 ene 1997 año
187.632 bn
+2.625 bn
1.42%
1 ene 1998 año
173.538 bn
-14.095 bn
-7.51%
1 ene 1999 año
176.992 bn
+3.454 bn
1.99%
1 ene 2000 año
177.965 bn
+973.224 millones
0.55%
1 ene 2001 año
164.159 bn
-13.806 bn
-7.76%
1 ene 2002 año
164.791 bn
+632.616 millones
0.39%
1 ene 2003 año
178.635 bn
+13.844 bn
8.4%
1 ene 2004 año
218.096 bn
+39.461 bn
22.09%
1 ene 2005 año
251.243 bn
+33.147 bn
15.2%
1 ene 2006 año
264.56 bn
+13.317 bn
5.3%
1 ene 2007 año
282.961 bn
+18.402 bn
6.96%
1 ene 2008 año
319.5 bn
+36.539 bn
12.91%
1 ene 2009 año
352.592 bn
+33.091 bn
10.36%
1 ene 2010 año
319.762 bn
-32.829 bn
-9.31%
1 ene 2011 año
319.811 bn
+48.639 millones
0.02%
1 ene 2012 año
341.499 bn
+21.688 bn
6.78%
1 ene 2013 año
325.012 bn
-16.487 bn
-4.83%
1 ene 2014 año
338.927 bn
+13.915 bn
4.28%
1 ene 2015 año
346.119 bn
+7.192 bn
2.12%
1 ene 2016 año
295.091 bn
-51.028 bn
-14.74%
Ranking de los países por los datos estadísticos actuales


Comentarios: