29
/es/
es
AIzaSyAYiBZKx7MnpbEhh9jyipgxe19OcubqV5w
April 1, 2024
34960
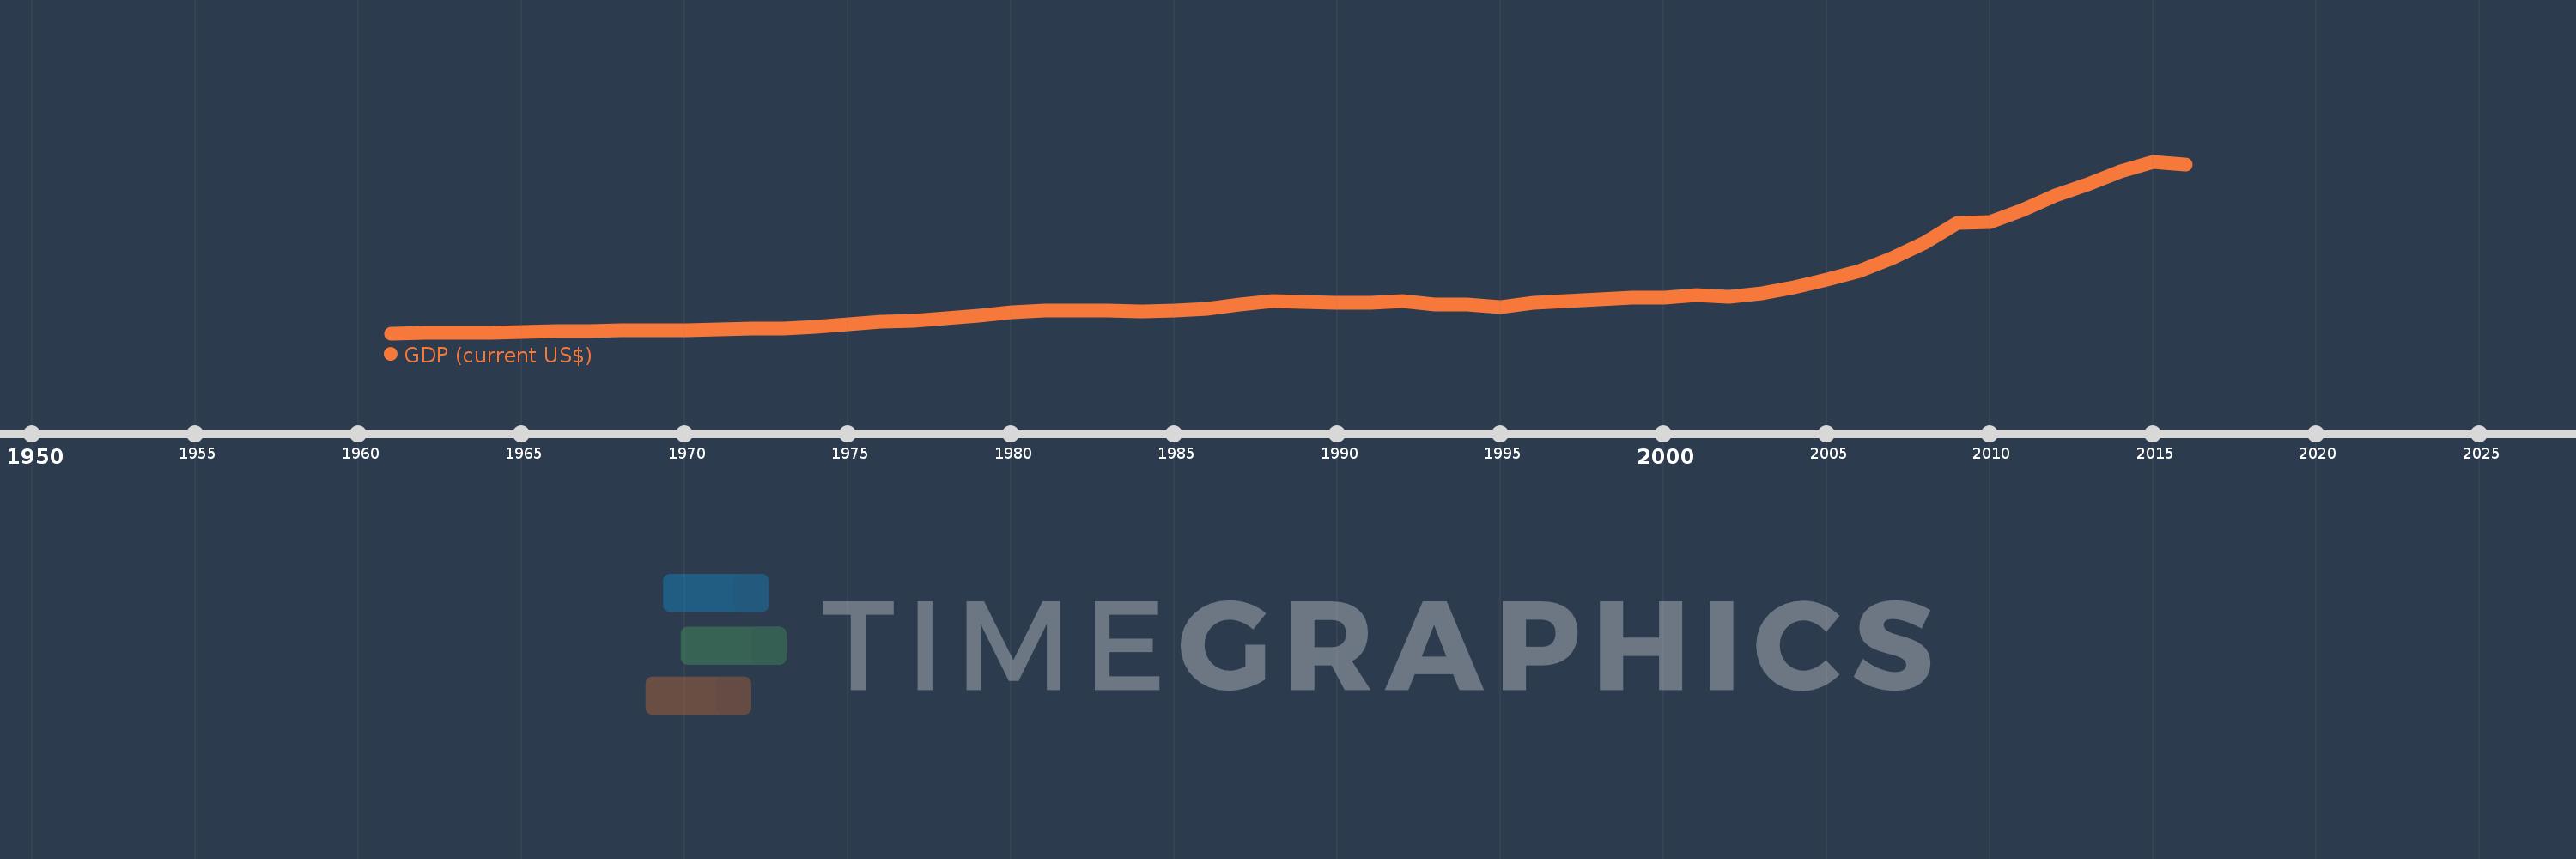
Heavily indebted poor countries (HIPC)
HPC
false
2
1
GDP (current US$)
2016,2015,2014,2013,2012,2011,2010,2009,2008,2007,2006,2005,2004,2003,2002,2001,2000,1999,1998,1997,1996,1995,1994,1993,1992,1991,1990,1989,1988,1987,1986,1985,1984,1983,1982,1981,1980,1979,1978,1977,1976,1975,1974,1973,1972,1971,1970,1969,1968,1967,1966,1965,1964,1963,1962,1961
Estas estadísticas en otros países:
AfghanistanAlbaniaAlgeriaAndorraAngolaAntigua and BarbudaArab WorldArgentinaArmeniaArubaAustraliaAustriaAzerbaijanBahamas, TheBahrainBangladeshBarbadosBelarusBelgiumBelizeBeninBermudaBhutanBoliviaBosnia and HerzegovinaBotswanaBrazilBrunei DarussalamBulgariaBurkina FasoBurundiCabo VerdeCambodiaCameroonCanadaCaribbean small statesCayman IslandsCentral African RepublicCentral Europe and the BalticsChadChannel IslandsChileChinaColombiaComorosCongo, Dem. Rep.Congo, Rep.Costa RicaCote d'IvoireCroatiaCubaCyprusCzech RepublicDenmarkDjiboutiDominicaDominican RepublicEarly-demographic dividendEast Asia & PacificEast Asia & Pacific (excluding high income)East Asia & Pacific (IDA & IBRD countries)EcuadorEgypt, Arab Rep.El SalvadorEquatorial GuineaEritreaEstoniaEthiopiaEuro areaEurope & Central AsiaEurope & Central Asia (excluding high income)Europe & Central Asia (IDA & IBRD countries)European UnionFaroe IslandsFijiFinlandFragile and conflict affected situationsFranceFrench PolynesiaGabonGambia, TheGeorgiaGermanyGhanaGreeceGreenlandGrenadaGuatemalaGuineaGuinea-BissauGuyanaHaitiHeavily indebted poor countries (HIPC)High incomeHondurasHong Kong SAR, ChinaHungaryIBRD onlyIcelandIDA & IBRD totalIDA blendIDA onlyIDA totalIndiaIndonesiaIran, Islamic Rep.IraqIrelandIsle of ManIsraelItalyJamaicaJapanJordanKazakhstanKenyaKiribatiKorea, Rep.KosovoKuwaitKyrgyz RepublicLao PDRLate-demographic dividendLatin America & Caribbean Latin America & Caribbean (excluding high income)Latin America & the Caribbean (IDA & IBRD countries)LatviaLeast developed countries: UN classificationLebanonLesothoLiberiaLibyaLiechtensteinLithuaniaLow & middle incomeLow incomeLower middle incomeLuxembourgMacao SAR, ChinaMacedonia, FYRMadagascarMalawiMalaysiaMaldivesMaliMaltaMarshall IslandsMauritaniaMauritiusMexicoMicronesia, Fed. Sts.Middle East & North AfricaMiddle East & North Africa (excluding high income)Middle East & North Africa (IDA & IBRD countries)Middle incomeMoldovaMonacoMongoliaMontenegroMoroccoMozambiqueMyanmarNamibiaNauruNepalNetherlandsNew CaledoniaNew ZealandNicaraguaNigerNigeriaNorth AmericaNorwayOECD membersOmanOther small statesPacific island small statesPakistanPalauPanamaPapua New GuineaParaguayPeruPhilippinesPolandPortugalPost-demographic dividendPre-demographic dividendPuerto RicoQatarRomaniaRussian FederationRwandaSamoaSan MarinoSao Tome and PrincipeSaudi ArabiaSenegalSerbiaSeychellesSierra LeoneSingaporeSlovak RepublicSloveniaSmall statesSolomon IslandsSomaliaSouth AfricaSouth AsiaSouth Asia (IDA & IBRD)South SudanSpainSri LankaSt. Kitts and NevisSt. LuciaSt. Vincent and the GrenadinesSub-Saharan Africa Sub-Saharan Africa (excluding high income)Sub-Saharan Africa (IDA & IBRD countries)SudanSurinameSwazilandSwedenSwitzerlandSyrian Arab RepublicTajikistanTanzaniaThailandTimor-LesteTogoTongaTrinidad and TobagoTunisiaTurkeyTurkmenistanTuvaluUgandaUkraineUnited Arab EmiratesUnited KingdomUnited StatesUpper middle incomeUruguayUzbekistanVanuatuVenezuela, RBVietnamVirgin Islands (U.S.)West Bank and GazaWorldYemen, Rep.ZambiaZimbabwe línea de tiempo (timeline):
En esta escala de tiempo se presenta un gráfico de 1961 y 2016 de Heavily indebted poor countries (HIPC). Los datos de 1960 están ausentes. El número de observaciones reales por fecha: 56.
Fuente (nombre):
Indicadores del desarrollo mundial
Fuente (organización):
World Bank national accounts data, and OECD National Accounts data files.
Categorías:
Economy & Growth
Se ha actualizado:
23 abr 2017 año
Los indicadores de los cambios de valor en los últimos años
Mínimo:
14.545 bn
1 ene 1961 año
Máximo:
639.849 bn
1 ene 2015 año
A la fecha de observación
Valor
Cambio absoluto
El cambio con respecto al valor anterior
1 ene 1961 año
14.545 bn
+14.545 bn
0.0%
1 ene 1962 año
15.415 bn
+870.005 millones
5.98%
1 ene 1963 año
16.252 bn
+837.203 millones
5.43%
1 ene 1964 año
17.484 bn
+1.232 bn
7.58%
1 ene 1965 año
19.099 bn
+1.615 bn
9.24%
1 ene 1966 año
21.458 bn
+2.359 bn
12.35%
1 ene 1967 año
23.238 bn
+1.78 bn
8.3%
1 ene 1968 año
24.154 bn
+915.731 millones
3.94%
1 ene 1969 año
24.78 bn
+626.1 millones
2.59%
1 ene 1970 año
26.779 bn
+1.999 bn
8.07%
1 ene 1971 año
28.589 bn
+1.81 bn
6.76%
1 ene 1972 año
30.384 bn
+1.795 bn
6.28%
1 ene 1973 año
32.751 bn
+2.367 bn
7.79%
1 ene 1974 año
38.922 bn
+6.171 bn
18.84%
1 ene 1975 año
48.061 bn
+9.14 bn
23.48%
1 ene 1976 año
55.206 bn
+7.144 bn
14.86%
1 ene 1977 año
60.32 bn
+5.115 bn
9.26%
1 ene 1978 año
70.127 bn
+9.807 bn
16.26%
1 ene 1979 año
77.914 bn
+7.787 bn
11.1%
1 ene 1980 año
90.053 bn
+12.139 bn
15.58%
1 ene 1981 año
96.346 bn
+6.293 bn
6.99%
1 ene 1982 año
98.606 bn
+2.26 bn
2.35%
1 ene 1983 año
97.046 bn
-1.56 bn
-1.58%
1 ene 1984 año
93.649 bn
-3.397 bn
-3.5%
1 ene 1985 año
97.191 bn
+3.542 bn
3.78%
1 ene 1986 año
103.217 bn
+6.026 bn
6.2%
1 ene 1987 año
118.495 bn
+15.278 bn
14.8%
1 ene 1988 año
131.965 bn
+13.47 bn
11.37%
1 ene 1989 año
130.05 bn
-1.915 bn
-1.45%
1 ene 1990 año
124.667 bn
-5.384 bn
-4.14%
1 ene 1991 año
126.883 bn
+2.217 bn
1.78%
1 ene 1992 año
131.105 bn
+4.222 bn
3.33%
1 ene 1993 año
119.897 bn
-11.209 bn
-8.55%
1 ene 1994 año
119.489 bn
-407.475 millones
-0.34%
1 ene 1995 año
110.379 bn
-9.111 bn
-7.62%
1 ene 1996 año
126.161 bn
+15.782 bn
14.3%
1 ene 1997 año
132.124 bn
+5.963 bn
4.73%
1 ene 1998 año
138.644 bn
+6.52 bn
4.94%
1 ene 1999 año
142.824 bn
+4.18 bn
3.01%
1 ene 2000 año
143.029 bn
+204.787 millones
0.14%
1 ene 2001 año
155.061 bn
+12.032 bn
8.41%
1 ene 2002 año
147.407 bn
-7.654 bn
-4.94%
1 ene 2003 año
160.219 bn
+12.812 bn
8.69%
1 ene 2004 año
182.221 bn
+22.003 bn
13.73%
1 ene 2005 año
209.458 bn
+27.237 bn
14.95%
1 ene 2006 año
242.138 bn
+32.68 bn
15.6%
1 ene 2007 año
289.277 bn
+47.138 bn
19.47%
1 ene 2008 año
344.272 bn
+54.995 bn
19.01%
1 ene 2009 año
414.809 bn
+70.537 bn
20.49%
1 ene 2010 año
418.334 bn
+3.524 bn
0.85%
1 ene 2011 año
462.939 bn
+44.606 bn
10.66%
1 ene 2012 año
517.789 bn
+54.85 bn
11.85%
1 ene 2013 año
558.051 bn
+40.261 bn
7.78%
1 ene 2014 año
604.48 bn
+46.43 bn
8.32%
1 ene 2015 año
639.849 bn
+35.369 bn
5.85%
1 ene 2016 año
629.25 bn
-10.6 bn
-1.66%
Ranking de los países por los datos estadísticos actuales


Comentarios: