29
/es/
es
AIzaSyAYiBZKx7MnpbEhh9jyipgxe19OcubqV5w
April 1, 2024
24100
Arab World
ARB
false
2
1
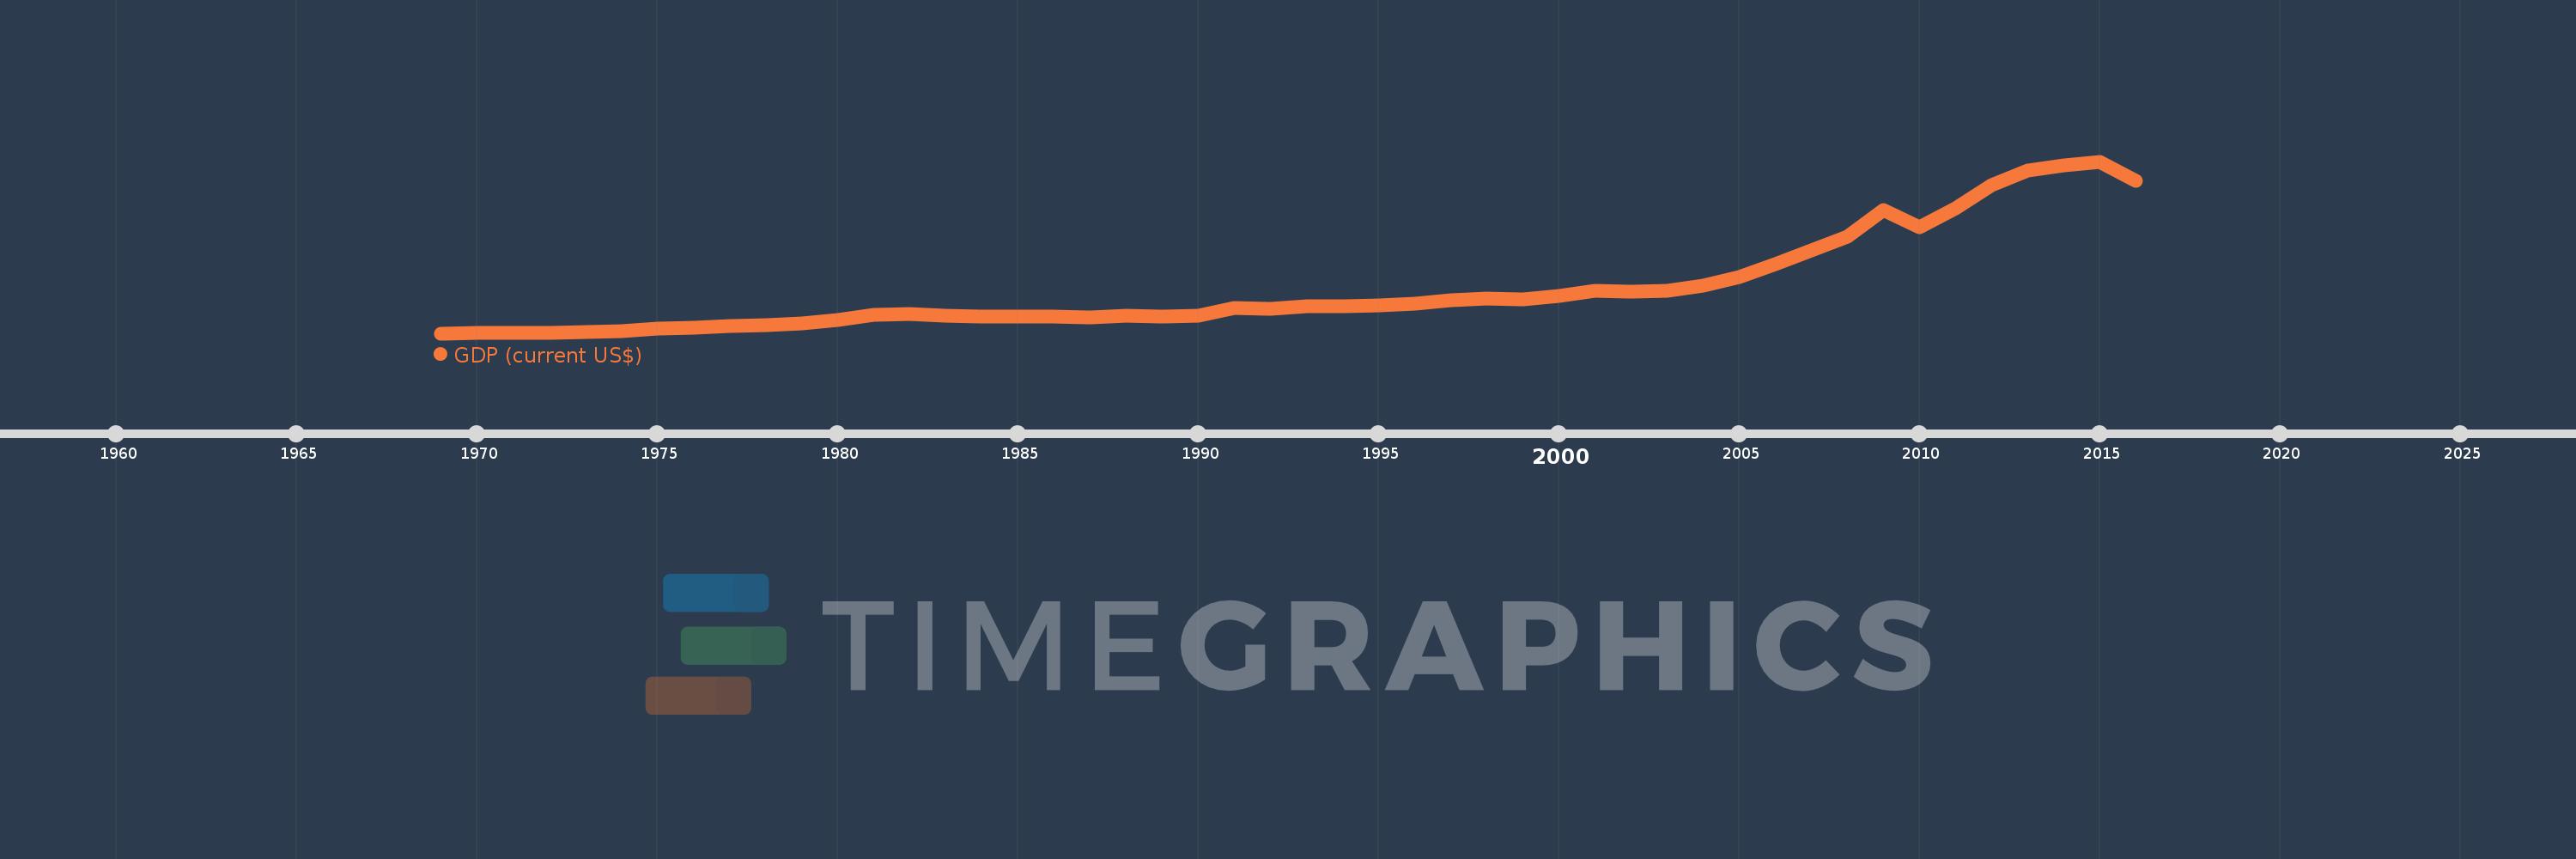
GDP (current US$)
2016,2015,2014,2013,2012,2011,2010,2009,2008,2007,2006,2005,2004,2003,2002,2001,2000,1999,1998,1997,1996,1995,1994,1993,1992,1991,1990,1989,1988,1987,1986,1985,1984,1983,1982,1981,1980,1979,1978,1977,1976,1975,1974,1973,1972,1971,1970,1969
Estas estadísticas en otros países:
AfghanistanAlbaniaAlgeriaAndorraAngolaAntigua and BarbudaArab WorldArgentinaArmeniaArubaAustraliaAustriaAzerbaijanBahamas, TheBahrainBangladeshBarbadosBelarusBelgiumBelizeBeninBermudaBhutanBoliviaBosnia and HerzegovinaBotswanaBrazilBrunei DarussalamBulgariaBurkina FasoBurundiCabo VerdeCambodiaCameroonCanadaCaribbean small statesCayman IslandsCentral African RepublicCentral Europe and the BalticsChadChannel IslandsChileChinaColombiaComorosCongo, Dem. Rep.Congo, Rep.Costa RicaCote d'IvoireCroatiaCubaCyprusCzech RepublicDenmarkDjiboutiDominicaDominican RepublicEarly-demographic dividendEast Asia & PacificEast Asia & Pacific (excluding high income)East Asia & Pacific (IDA & IBRD countries)EcuadorEgypt, Arab Rep.El SalvadorEquatorial GuineaEritreaEstoniaEthiopiaEuro areaEurope & Central AsiaEurope & Central Asia (excluding high income)Europe & Central Asia (IDA & IBRD countries)European UnionFaroe IslandsFijiFinlandFragile and conflict affected situationsFranceFrench PolynesiaGabonGambia, TheGeorgiaGermanyGhanaGreeceGreenlandGrenadaGuatemalaGuineaGuinea-BissauGuyanaHaitiHeavily indebted poor countries (HIPC)High incomeHondurasHong Kong SAR, ChinaHungaryIBRD onlyIcelandIDA & IBRD totalIDA blendIDA onlyIDA totalIndiaIndonesiaIran, Islamic Rep.IraqIrelandIsle of ManIsraelItalyJamaicaJapanJordanKazakhstanKenyaKiribatiKorea, Rep.KosovoKuwaitKyrgyz RepublicLao PDRLate-demographic dividendLatin America & Caribbean Latin America & Caribbean (excluding high income)Latin America & the Caribbean (IDA & IBRD countries)LatviaLeast developed countries: UN classificationLebanonLesothoLiberiaLibyaLiechtensteinLithuaniaLow & middle incomeLow incomeLower middle incomeLuxembourgMacao SAR, ChinaMacedonia, FYRMadagascarMalawiMalaysiaMaldivesMaliMaltaMarshall IslandsMauritaniaMauritiusMexicoMicronesia, Fed. Sts.Middle East & North AfricaMiddle East & North Africa (excluding high income)Middle East & North Africa (IDA & IBRD countries)Middle incomeMoldovaMonacoMongoliaMontenegroMoroccoMozambiqueMyanmarNamibiaNauruNepalNetherlandsNew CaledoniaNew ZealandNicaraguaNigerNigeriaNorth AmericaNorwayOECD membersOmanOther small statesPacific island small statesPakistanPalauPanamaPapua New GuineaParaguayPeruPhilippinesPolandPortugalPost-demographic dividendPre-demographic dividendPuerto RicoQatarRomaniaRussian FederationRwandaSamoaSan MarinoSao Tome and PrincipeSaudi ArabiaSenegalSerbiaSeychellesSierra LeoneSingaporeSlovak RepublicSloveniaSmall statesSolomon IslandsSomaliaSouth AfricaSouth AsiaSouth Asia (IDA & IBRD)South SudanSpainSri LankaSt. Kitts and NevisSt. LuciaSt. Vincent and the GrenadinesSub-Saharan Africa Sub-Saharan Africa (excluding high income)Sub-Saharan Africa (IDA & IBRD countries)SudanSurinameSwazilandSwedenSwitzerlandSyrian Arab RepublicTajikistanTanzaniaThailandTimor-LesteTogoTongaTrinidad and TobagoTunisiaTurkeyTurkmenistanTuvaluUgandaUkraineUnited Arab EmiratesUnited KingdomUnited StatesUpper middle incomeUruguayUzbekistanVanuatuVenezuela, RBVietnamVirgin Islands (U.S.)West Bank and GazaWorldYemen, Rep.ZambiaZimbabwe línea de tiempo (timeline):
En esta escala de tiempo se presenta un gráfico de 1969 y 2016 de Arab World. Los datos de 1968 están ausentes. El número de observaciones reales por fecha: 48.
Fuente (nombre):
Indicadores del desarrollo mundial
Fuente (organización):
World Bank national accounts data, and OECD National Accounts data files.
Categorías:
Economy & Growth
Se ha actualizado:
23 abr 2017 año
Los indicadores de los cambios de valor en los últimos años
Mínimo:
25.748 bn
1 ene 1969 año
Máximo:
2.89 billones
1 ene 2015 año
A la fecha de observación
Valor
Cambio absoluto
El cambio con respecto al valor anterior
1 ene 1969 año
25.748 bn
+25.748 bn
0.0%
1 ene 1970 año
28.42 bn
+2.672 bn
10.38%
1 ene 1971 año
31.37 bn
+2.95 bn
10.38%
1 ene 1972 año
36.409 bn
+5.039 bn
16.06%
1 ene 1973 año
43.294 bn
+6.886 bn
18.91%
1 ene 1974 año
54.991 bn
+11.696 bn
27.02%
1 ene 1975 año
105.093 bn
+50.102 bn
91.11%
1 ene 1976 año
116.279 bn
+11.186 bn
10.64%
1 ene 1977 año
144.774 bn
+28.495 bn
24.51%
1 ene 1978 año
167.225 bn
+22.451 bn
15.51%
1 ene 1979 año
183.464 bn
+16.239 bn
9.71%
1 ene 1980 año
248.522 bn
+65.058 bn
35.46%
1 ene 1981 año
338.009 bn
+89.487 bn
36.01%
1 ene 1982 año
348.419 bn
+10.41 bn
3.08%
1 ene 1983 año
324.167 bn
-24.252 bn
-6.96%
1 ene 1984 año
303.811 bn
-20.356 bn
-6.28%
1 ene 1985 año
307.787 bn
+3.976 bn
1.31%
1 ene 1986 año
303.742 bn
-4.045 bn
-1.31%
1 ene 1987 año
288.885 bn
-14.857 bn
-4.89%
1 ene 1988 año
312.526 bn
+23.641 bn
8.18%
1 ene 1989 año
307.35 bn
-5.176 bn
-1.66%
1 ene 1990 año
322.164 bn
+14.815 bn
4.82%
1 ene 1991 año
445.988 bn
+123.823 bn
38.43%
1 ene 1992 año
438.853 bn
-7.135 bn
-1.6%
1 ene 1993 año
470.346 bn
+31.493 bn
7.18%
1 ene 1994 año
475.662 bn
+5.316 bn
1.13%
1 ene 1995 año
486.642 bn
+10.981 bn
2.31%
1 ene 1996 año
522.836 bn
+36.194 bn
7.44%
1 ene 1997 año
577.272 bn
+54.436 bn
10.41%
1 ene 1998 año
612.266 bn
+34.994 bn
6.06%
1 ene 1999 año
590.478 bn
-21.788 bn
-3.56%
1 ene 2000 año
643.095 bn
+52.618 bn
8.91%
1 ene 2001 año
733.903 bn
+90.808 bn
14.12%
1 ene 2002 año
722.106 bn
-11.797 bn
-1.61%
1 ene 2003 año
727.949 bn
+5.843 bn
0.81%
1 ene 2004 año
821.82 bn
+93.871 bn
12.9%
1 ene 2005 año
963.859 bn
+142.039 bn
17.28%
1 ene 2006 año
1.185 billones
+220.803 bn
22.91%
1 ene 2007 año
1.404 billones
+219.441 bn
18.52%
1 ene 2008 año
1.638 billones
+233.471 bn
16.63%
1 ene 2009 año
2.078 billones
+440.187 bn
26.88%
1 ene 2010 año
1.795 billones
-282.299 bn
-13.59%
1 ene 2011 año
2.104 billones
+308.377 bn
17.18%
1 ene 2012 año
2.497 billones
+393.458 bn
18.7%
1 ene 2013 año
2.734 billones
+236.611 bn
9.47%
1 ene 2014 año
2.831 billones
+96.912 bn
3.54%
1 ene 2015 año
2.89 billones
+58.935 bn
2.08%
1 ene 2016 año
2.566 billones
-323.884 bn
-11.21%
Ranking de los países por los datos estadísticos actuales


Comentarios: