29
/es/
es
AIzaSyAYiBZKx7MnpbEhh9jyipgxe19OcubqV5w
April 1, 2024
101080
Canada
CAN
true
2
1
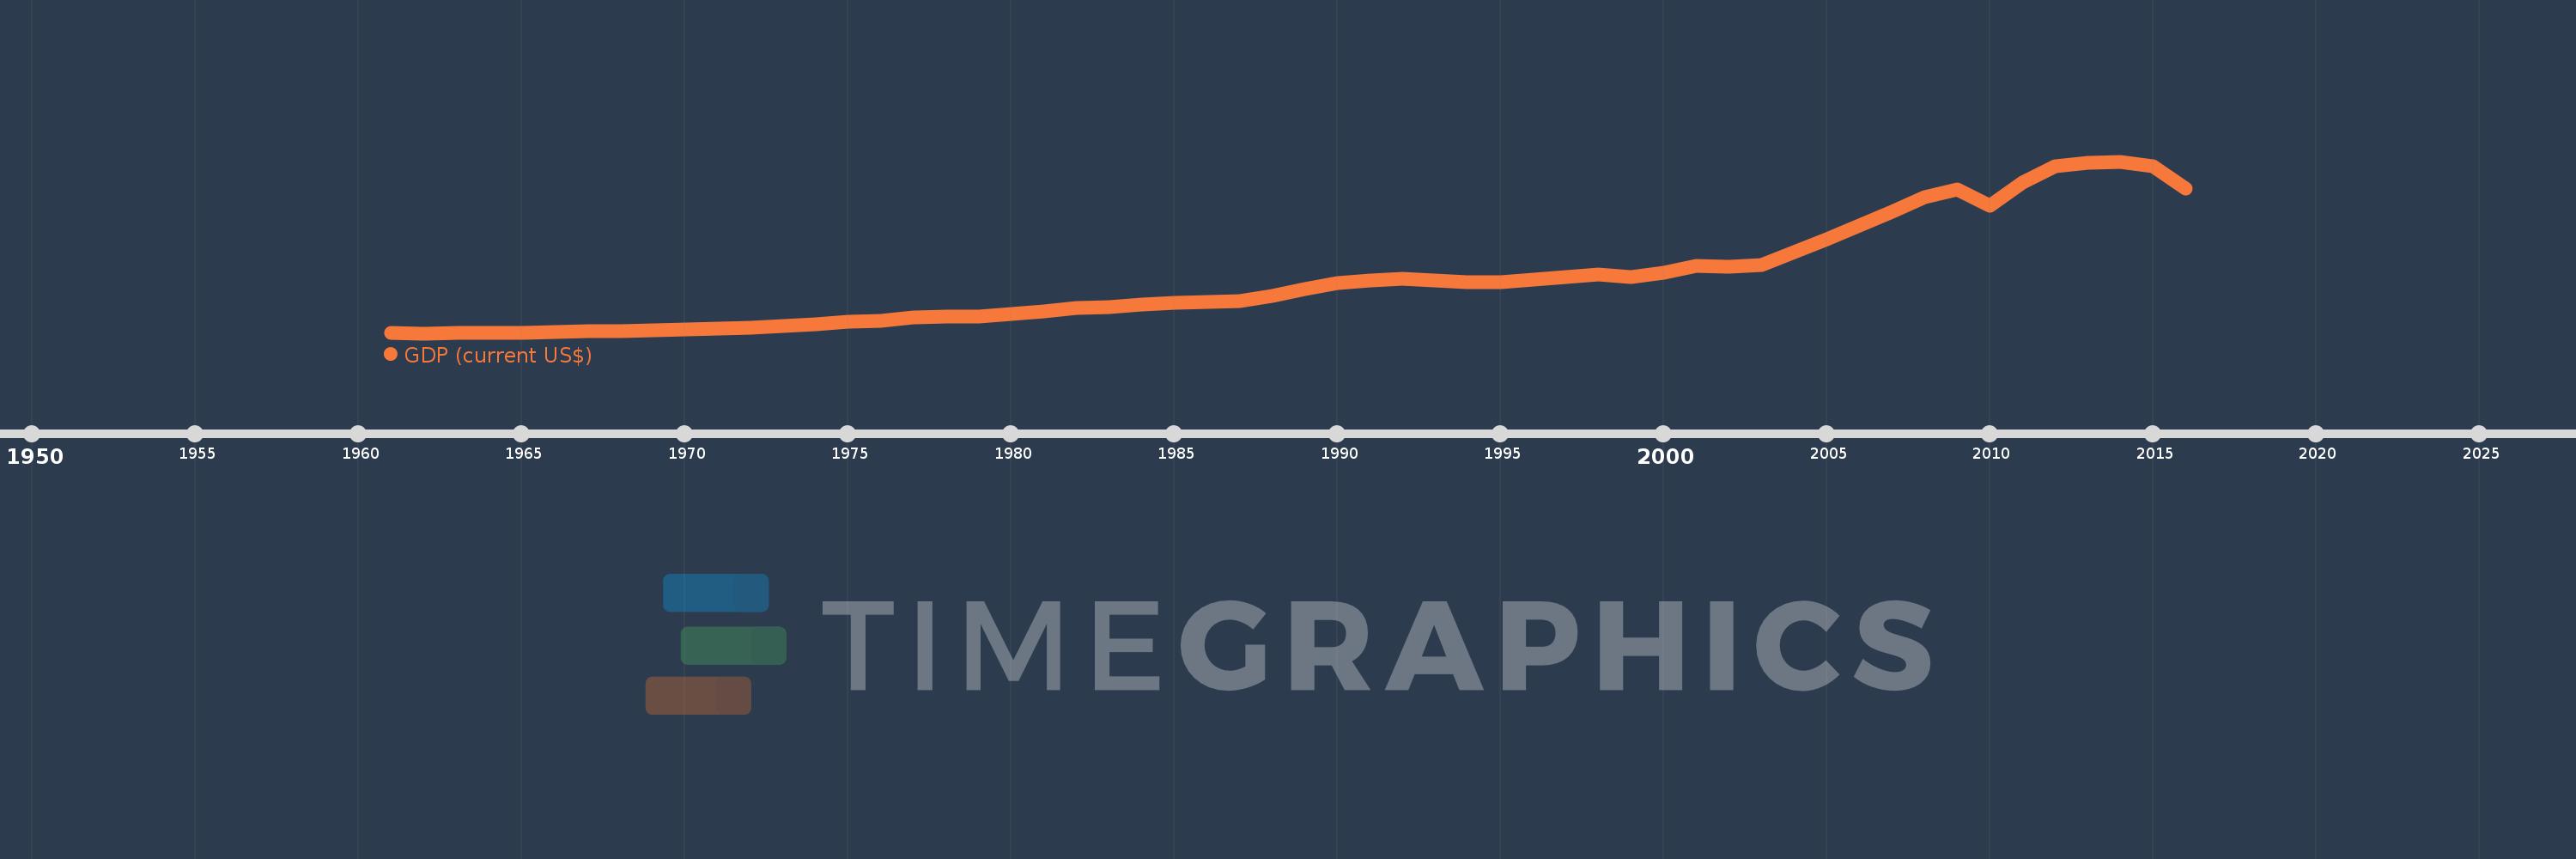
GDP (current US$)
2016,2015,2014,2013,2012,2011,2010,2009,2008,2007,2006,2005,2004,2003,2002,2001,2000,1999,1998,1997,1996,1995,1994,1993,1992,1991,1990,1989,1988,1987,1986,1985,1984,1983,1982,1981,1980,1979,1978,1977,1976,1975,1974,1973,1972,1971,1970,1969,1968,1967,1966,1965,1964,1963,1962,1961
Estas estadísticas en otros países:
AfghanistanAlbaniaAlgeriaAndorraAngolaAntigua and BarbudaArab WorldArgentinaArmeniaArubaAustraliaAustriaAzerbaijanBahamas, TheBahrainBangladeshBarbadosBelarusBelgiumBelizeBeninBermudaBhutanBoliviaBosnia and HerzegovinaBotswanaBrazilBrunei DarussalamBulgariaBurkina FasoBurundiCabo VerdeCambodiaCameroonCanadaCaribbean small statesCayman IslandsCentral African RepublicCentral Europe and the BalticsChadChannel IslandsChileChinaColombiaComorosCongo, Dem. Rep.Congo, Rep.Costa RicaCote d'IvoireCroatiaCubaCyprusCzech RepublicDenmarkDjiboutiDominicaDominican RepublicEarly-demographic dividendEast Asia & PacificEast Asia & Pacific (excluding high income)East Asia & Pacific (IDA & IBRD countries)EcuadorEgypt, Arab Rep.El SalvadorEquatorial GuineaEritreaEstoniaEthiopiaEuro areaEurope & Central AsiaEurope & Central Asia (excluding high income)Europe & Central Asia (IDA & IBRD countries)European UnionFaroe IslandsFijiFinlandFragile and conflict affected situationsFranceFrench PolynesiaGabonGambia, TheGeorgiaGermanyGhanaGreeceGreenlandGrenadaGuatemalaGuineaGuinea-BissauGuyanaHaitiHeavily indebted poor countries (HIPC)High incomeHondurasHong Kong SAR, ChinaHungaryIBRD onlyIcelandIDA & IBRD totalIDA blendIDA onlyIDA totalIndiaIndonesiaIran, Islamic Rep.IraqIrelandIsle of ManIsraelItalyJamaicaJapanJordanKazakhstanKenyaKiribatiKorea, Rep.KosovoKuwaitKyrgyz RepublicLao PDRLate-demographic dividendLatin America & Caribbean Latin America & Caribbean (excluding high income)Latin America & the Caribbean (IDA & IBRD countries)LatviaLeast developed countries: UN classificationLebanonLesothoLiberiaLibyaLiechtensteinLithuaniaLow & middle incomeLow incomeLower middle incomeLuxembourgMacao SAR, ChinaMacedonia, FYRMadagascarMalawiMalaysiaMaldivesMaliMaltaMarshall IslandsMauritaniaMauritiusMexicoMicronesia, Fed. Sts.Middle East & North AfricaMiddle East & North Africa (excluding high income)Middle East & North Africa (IDA & IBRD countries)Middle incomeMoldovaMonacoMongoliaMontenegroMoroccoMozambiqueMyanmarNamibiaNauruNepalNetherlandsNew CaledoniaNew ZealandNicaraguaNigerNigeriaNorth AmericaNorwayOECD membersOmanOther small statesPacific island small statesPakistanPalauPanamaPapua New GuineaParaguayPeruPhilippinesPolandPortugalPost-demographic dividendPre-demographic dividendPuerto RicoQatarRomaniaRussian FederationRwandaSamoaSan MarinoSao Tome and PrincipeSaudi ArabiaSenegalSerbiaSeychellesSierra LeoneSingaporeSlovak RepublicSloveniaSmall statesSolomon IslandsSomaliaSouth AfricaSouth AsiaSouth Asia (IDA & IBRD)South SudanSpainSri LankaSt. Kitts and NevisSt. LuciaSt. Vincent and the GrenadinesSub-Saharan Africa Sub-Saharan Africa (excluding high income)Sub-Saharan Africa (IDA & IBRD countries)SudanSurinameSwazilandSwedenSwitzerlandSyrian Arab RepublicTajikistanTanzaniaThailandTimor-LesteTogoTongaTrinidad and TobagoTunisiaTurkeyTurkmenistanTuvaluUgandaUkraineUnited Arab EmiratesUnited KingdomUnited StatesUpper middle incomeUruguayUzbekistanVanuatuVenezuela, RBVietnamVirgin Islands (U.S.)West Bank and GazaWorldYemen, Rep.ZambiaZimbabwe línea de tiempo (timeline):
En esta escala de tiempo se presenta un gráfico de 1961 y 2016 de Canada. Los datos de 1960 están ausentes. El número de observaciones reales por fecha: 56.
Fuente (nombre):
Indicadores del desarrollo mundial
Fuente (organización):
World Bank national accounts data, and OECD National Accounts data files.
Categorías:
Economy & Growth
Se ha actualizado:
23 abr 2017 año
Los indicadores de los cambios de valor en los últimos años
Mínimo:
40.768 bn
1 ene 1962 año
Máximo:
1.837 billones
1 ene 2014 año
A la fecha de observación
Valor
Cambio absoluto
El cambio con respecto al valor anterior
1 ene 1961 año
41.093 bn
+41.093 bn
0.0%
1 ene 1962 año
40.768 bn
-325.484 millones
-0.79%
1 ene 1963 año
41.979 bn
+1.211 bn
2.97%
1 ene 1964 año
44.657 bn
+2.678 bn
6.38%
1 ene 1965 año
48.883 bn
+4.226 bn
9.46%
1 ene 1966 año
53.91 bn
+5.027 bn
10.28%
1 ene 1967 año
60.359 bn
+6.449 bn
11.96%
1 ene 1968 año
64.769 bn
+4.41 bn
7.31%
1 ene 1969 año
70.759 bn
+5.99 bn
9.25%
1 ene 1970 año
77.888 bn
+7.128 bn
10.07%
1 ene 1971 año
87.896 bn
+10.009 bn
12.85%
1 ene 1972 año
99.272 bn
+11.376 bn
12.94%
1 ene 1973 año
113.083 bn
+13.811 bn
13.91%
1 ene 1974 año
131.322 bn
+18.239 bn
16.13%
1 ene 1975 año
160.409 bn
+29.087 bn
22.15%
1 ene 1976 año
173.834 bn
+13.425 bn
8.37%
1 ene 1977 año
206.576 bn
+32.742 bn
18.83%
1 ene 1978 año
211.612 bn
+5.037 bn
2.44%
1 ene 1979 año
218.633 bn
+7.021 bn
3.32%
1 ene 1980 año
243.072 bn
+24.439 bn
11.18%
1 ene 1981 año
273.854 bn
+30.782 bn
12.66%
1 ene 1982 año
306.215 bn
+32.361 bn
11.82%
1 ene 1983 año
313.507 bn
+7.292 bn
2.38%
1 ene 1984 año
340.548 bn
+27.041 bn
8.63%
1 ene 1985 año
355.373 bn
+14.825 bn
4.35%
1 ene 1986 año
364.756 bn
+9.384 bn
2.64%
1 ene 1987 año
377.438 bn
+12.681 bn
3.48%
1 ene 1988 año
431.317 bn
+53.879 bn
14.27%
1 ene 1989 año
507.354 bn
+76.038 bn
17.63%
1 ene 1990 año
565.056 bn
+57.701 bn
11.37%
1 ene 1991 año
593.93 bn
+28.874 bn
5.11%
1 ene 1992 año
610.328 bn
+16.399 bn
2.76%
1 ene 1993 año
592.388 bn
-17.94 bn
-2.94%
1 ene 1994 año
577.171 bn
-15.217 bn
-2.57%
1 ene 1995 año
578.139 bn
+968.517 millones
0.17%
1 ene 1996 año
604.032 bn
+25.892 bn
4.48%
1 ene 1997 año
628.546 bn
+24.515 bn
4.06%
1 ene 1998 año
652.825 bn
+24.279 bn
3.86%
1 ene 1999 año
631.813 bn
-21.012 bn
-3.22%
1 ene 2000 año
676.083 bn
+44.269 bn
7.01%
1 ene 2001 año
742.293 bn
+66.211 bn
9.79%
1 ene 2002 año
736.38 bn
-5.914 bn
-0.8%
1 ene 2003 año
757.951 bn
+21.571 bn
2.93%
1 ene 2004 año
892.381 bn
+134.43 bn
17.74%
1 ene 2005 año
1.023 billones
+130.815 bn
14.66%
1 ene 2006 año
1.169 billones
+146.162 bn
14.28%
1 ene 2007 año
1.315 billones
+146.057 bn
12.49%
1 ene 2008 año
1.465 billones
+149.562 bn
11.37%
1 ene 2009 año
1.549 billones
+84.154 bn
5.74%
1 ene 2010 año
1.371 billones
-177.978 bn
-11.49%
1 ene 2011 año
1.613 billones
+242.253 bn
17.67%
1 ene 2012 año
1.789 billones
+175.297 bn
10.87%
1 ene 2013 año
1.824 billones
+35.585 bn
1.99%
1 ene 2014 año
1.837 billones
+13.155 bn
0.72%
1 ene 2015 año
1.784 billones
-53.668 bn
-2.92%
1 ene 2016 año
1.551 billones
-233.239 bn
-13.08%
Ranking de los países por los datos estadísticos actuales


Comentarios: