29
/es/
es
AIzaSyAYiBZKx7MnpbEhh9jyipgxe19OcubqV5w
April 1, 2024
253018
Sudan
SDN
true
2
1
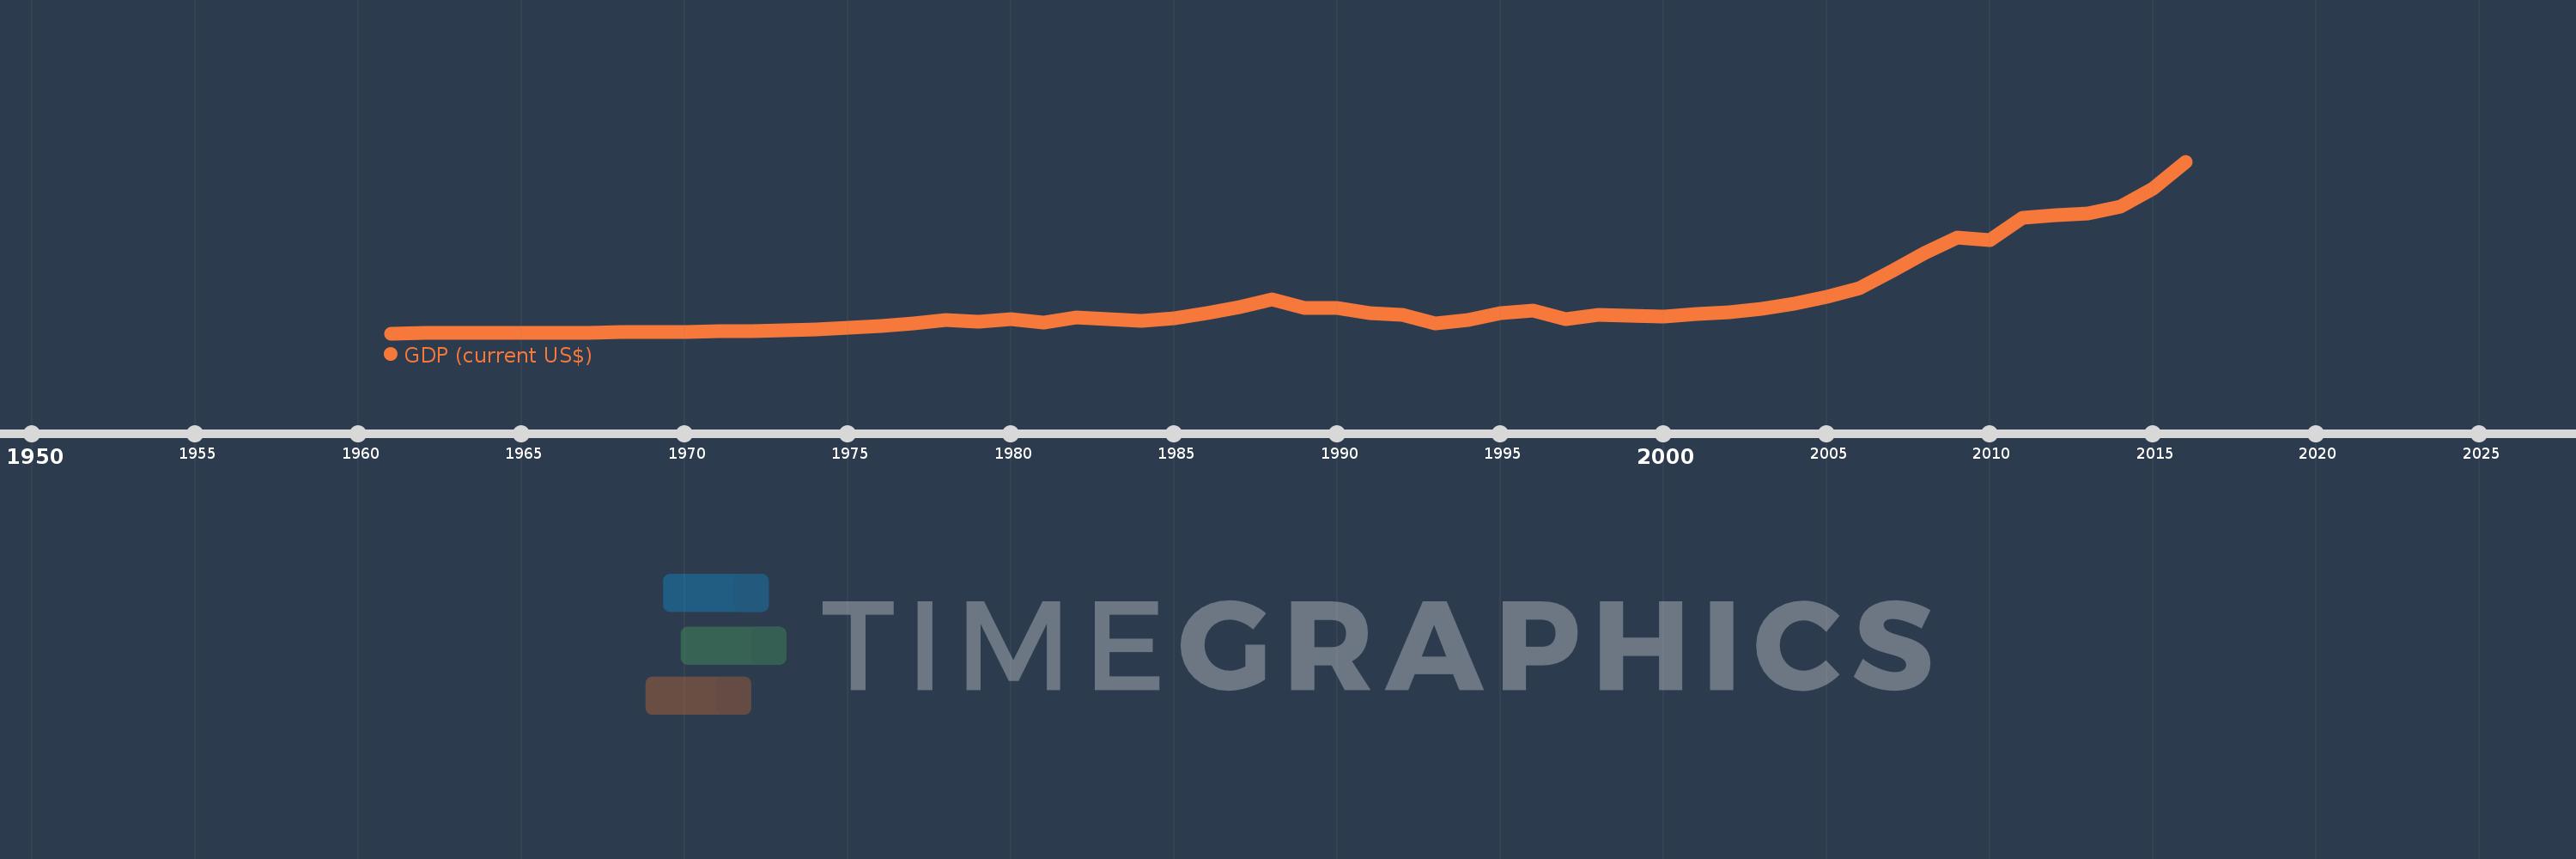
GDP (current US$)
2016,2015,2014,2013,2012,2011,2010,2009,2008,2007,2006,2005,2004,2003,2002,2001,2000,1999,1998,1997,1996,1995,1994,1993,1992,1991,1990,1989,1988,1987,1986,1985,1984,1983,1982,1981,1980,1979,1978,1977,1976,1975,1974,1973,1972,1971,1970,1969,1968,1967,1966,1965,1964,1963,1962,1961
Estas estadísticas en otros países:
AfghanistanAlbaniaAlgeriaAndorraAngolaAntigua and BarbudaArab WorldArgentinaArmeniaArubaAustraliaAustriaAzerbaijanBahamas, TheBahrainBangladeshBarbadosBelarusBelgiumBelizeBeninBermudaBhutanBoliviaBosnia and HerzegovinaBotswanaBrazilBrunei DarussalamBulgariaBurkina FasoBurundiCabo VerdeCambodiaCameroonCanadaCaribbean small statesCayman IslandsCentral African RepublicCentral Europe and the BalticsChadChannel IslandsChileChinaColombiaComorosCongo, Dem. Rep.Congo, Rep.Costa RicaCote d'IvoireCroatiaCubaCyprusCzech RepublicDenmarkDjiboutiDominicaDominican RepublicEarly-demographic dividendEast Asia & PacificEast Asia & Pacific (excluding high income)East Asia & Pacific (IDA & IBRD countries)EcuadorEgypt, Arab Rep.El SalvadorEquatorial GuineaEritreaEstoniaEthiopiaEuro areaEurope & Central AsiaEurope & Central Asia (excluding high income)Europe & Central Asia (IDA & IBRD countries)European UnionFaroe IslandsFijiFinlandFragile and conflict affected situationsFranceFrench PolynesiaGabonGambia, TheGeorgiaGermanyGhanaGreeceGreenlandGrenadaGuatemalaGuineaGuinea-BissauGuyanaHaitiHeavily indebted poor countries (HIPC)High incomeHondurasHong Kong SAR, ChinaHungaryIBRD onlyIcelandIDA & IBRD totalIDA blendIDA onlyIDA totalIndiaIndonesiaIran, Islamic Rep.IraqIrelandIsle of ManIsraelItalyJamaicaJapanJordanKazakhstanKenyaKiribatiKorea, Rep.KosovoKuwaitKyrgyz RepublicLao PDRLate-demographic dividendLatin America & Caribbean Latin America & Caribbean (excluding high income)Latin America & the Caribbean (IDA & IBRD countries)LatviaLeast developed countries: UN classificationLebanonLesothoLiberiaLibyaLiechtensteinLithuaniaLow & middle incomeLow incomeLower middle incomeLuxembourgMacao SAR, ChinaMacedonia, FYRMadagascarMalawiMalaysiaMaldivesMaliMaltaMarshall IslandsMauritaniaMauritiusMexicoMicronesia, Fed. Sts.Middle East & North AfricaMiddle East & North Africa (excluding high income)Middle East & North Africa (IDA & IBRD countries)Middle incomeMoldovaMonacoMongoliaMontenegroMoroccoMozambiqueMyanmarNamibiaNauruNepalNetherlandsNew CaledoniaNew ZealandNicaraguaNigerNigeriaNorth AmericaNorwayOECD membersOmanOther small statesPacific island small statesPakistanPalauPanamaPapua New GuineaParaguayPeruPhilippinesPolandPortugalPost-demographic dividendPre-demographic dividendPuerto RicoQatarRomaniaRussian FederationRwandaSamoaSan MarinoSao Tome and PrincipeSaudi ArabiaSenegalSerbiaSeychellesSierra LeoneSingaporeSlovak RepublicSloveniaSmall statesSolomon IslandsSomaliaSouth AfricaSouth AsiaSouth Asia (IDA & IBRD)South SudanSpainSri LankaSt. Kitts and NevisSt. LuciaSt. Vincent and the GrenadinesSub-Saharan Africa Sub-Saharan Africa (excluding high income)Sub-Saharan Africa (IDA & IBRD countries)SudanSurinameSwazilandSwedenSwitzerlandSyrian Arab RepublicTajikistanTanzaniaThailandTimor-LesteTogoTongaTrinidad and TobagoTunisiaTurkeyTurkmenistanTuvaluUgandaUkraineUnited Arab EmiratesUnited KingdomUnited StatesUpper middle incomeUruguayUzbekistanVanuatuVenezuela, RBVietnamVirgin Islands (U.S.)West Bank and GazaWorldYemen, Rep.ZambiaZimbabwe línea de tiempo (timeline):
En esta escala de tiempo se presenta un gráfico de 1961 y 2016 de Sudan. Los datos de 1960 están ausentes. El número de observaciones reales por fecha: 56.
Fuente (nombre):
Indicadores del desarrollo mundial
Fuente (organización):
World Bank national accounts data, and OECD National Accounts data files.
Categorías:
Economy & Growth
Se ha actualizado:
23 abr 2017 año
Los indicadores de los cambios de valor en los últimos años
Mínimo:
1.307 bn
1 ene 1961 año
Máximo:
97.156 bn
1 ene 2016 año
A la fecha de observación
Valor
Cambio absoluto
El cambio con respecto al valor anterior
1 ene 1961 año
1.307 bn
+1.307 bn
0.0%
1 ene 1962 año
1.419 bn
+112.0 millones
8.57%
1 ene 1963 año
1.542 bn
+122.333 millones
8.62%
1 ene 1964 año
1.568 bn
+26.667 millones
1.73%
1 ene 1965 año
1.611 bn
+43.0 millones
2.74%
1 ene 1966 año
1.679 bn
+68.0 millones
4.22%
1 ene 1967 año
1.723 bn
+43.667 millones
2.6%
1 ene 1968 año
1.866 bn
+142.667 millones
8.28%
1 ene 1969 año
1.947 bn
+81.667 millones
4.38%
1 ene 1970 año
2.144 bn
+197.0 millones
10.12%
1 ene 1971 año
2.438 bn
+293.333 millones
13.68%
1 ene 1972 año
2.656 bn
+218.333 millones
8.96%
1 ene 1973 año
2.882 bn
+226.0 millones
8.51%
1 ene 1974 año
3.572 bn
+689.667 millones
23.93%
1 ene 1975 año
4.595 bn
+1.023 bn
28.65%
1 ene 1976 año
5.598 bn
+1.003 bn
21.83%
1 ene 1977 año
6.979 bn
+1.381 bn
24.68%
1 ene 1978 año
8.704 bn
+1.725 bn
24.71%
1 ene 1979 año
7.67 bn
-1.034 bn
-11.87%
1 ene 1980 año
9.032 bn
+1.362 bn
17.75%
1 ene 1981 año
7.46 bn
-1.572 bn
-17.41%
1 ene 1982 año
10.017 bn
+2.557 bn
34.27%
1 ene 1983 año
9.24 bn
-776.5 millones
-7.75%
1 ene 1984 año
8.23 bn
-1.01 bn
-10.93%
1 ene 1985 año
9.701 bn
+1.471 bn
17.88%
1 ene 1986 año
12.404 bn
+2.702 bn
27.86%
1 ene 1987 año
15.769 bn
+3.365 bn
27.13%
1 ene 1988 año
20.156 bn
+4.386 bn
27.82%
1 ene 1989 año
15.399 bn
-4.756 bn
-23.6%
1 ene 1990 año
15.292 bn
-107.659 millones
-0.7%
1 ene 1991 año
12.409 bn
-2.883 bn
-18.85%
1 ene 1992 año
11.379 bn
-1.029 bn
-8.3%
1 ene 1993 año
7.034 bn
-4.345 bn
-38.18%
1 ene 1994 año
8.882 bn
+1.848 bn
26.27%
1 ene 1995 año
12.794 bn
+3.912 bn
44.05%
1 ene 1996 año
13.83 bn
+1.036 bn
8.09%
1 ene 1997 año
9.018 bn
-4.812 bn
-34.79%
1 ene 1998 año
11.681 bn
+2.663 bn
29.53%
1 ene 1999 año
11.25 bn
-431.167 millones
-3.69%
1 ene 2000 año
10.682 bn
-568.283 millones
-5.05%
1 ene 2001 año
12.257 bn
+1.575 bn
14.75%
1 ene 2002 año
13.183 bn
+925.561 millones
7.55%
1 ene 2003 año
14.803 bn
+1.62 bn
12.29%
1 ene 2004 año
17.647 bn
+2.843 bn
19.21%
1 ene 2005 año
21.457 bn
+3.811 bn
21.6%
1 ene 2006 año
26.525 bn
+5.067 bn
23.61%
1 ene 2007 año
35.822 bn
+9.298 bn
35.05%
1 ene 2008 año
45.899 bn
+10.077 bn
28.13%
1 ene 2009 año
54.527 bn
+8.628 bn
18.8%
1 ene 2010 año
53.15 bn
-1.376 bn
-2.52%
1 ene 2011 año
65.634 bn
+12.484 bn
23.49%
1 ene 2012 año
67.327 bn
+1.693 bn
2.58%
1 ene 2013 año
68.126 bn
+798.342 millones
1.19%
1 ene 2014 año
72.066 bn
+3.94 bn
5.78%
1 ene 2015 año
82.152 bn
+10.086 bn
14.0%
1 ene 2016 año
97.156 bn
+15.005 bn
18.26%
Ranking de los países por los datos estadísticos actuales


Comentarios: