29
/es/
es
AIzaSyAYiBZKx7MnpbEhh9jyipgxe19OcubqV5w
April 1, 2024
84547
Benin
BEN
true
2
1
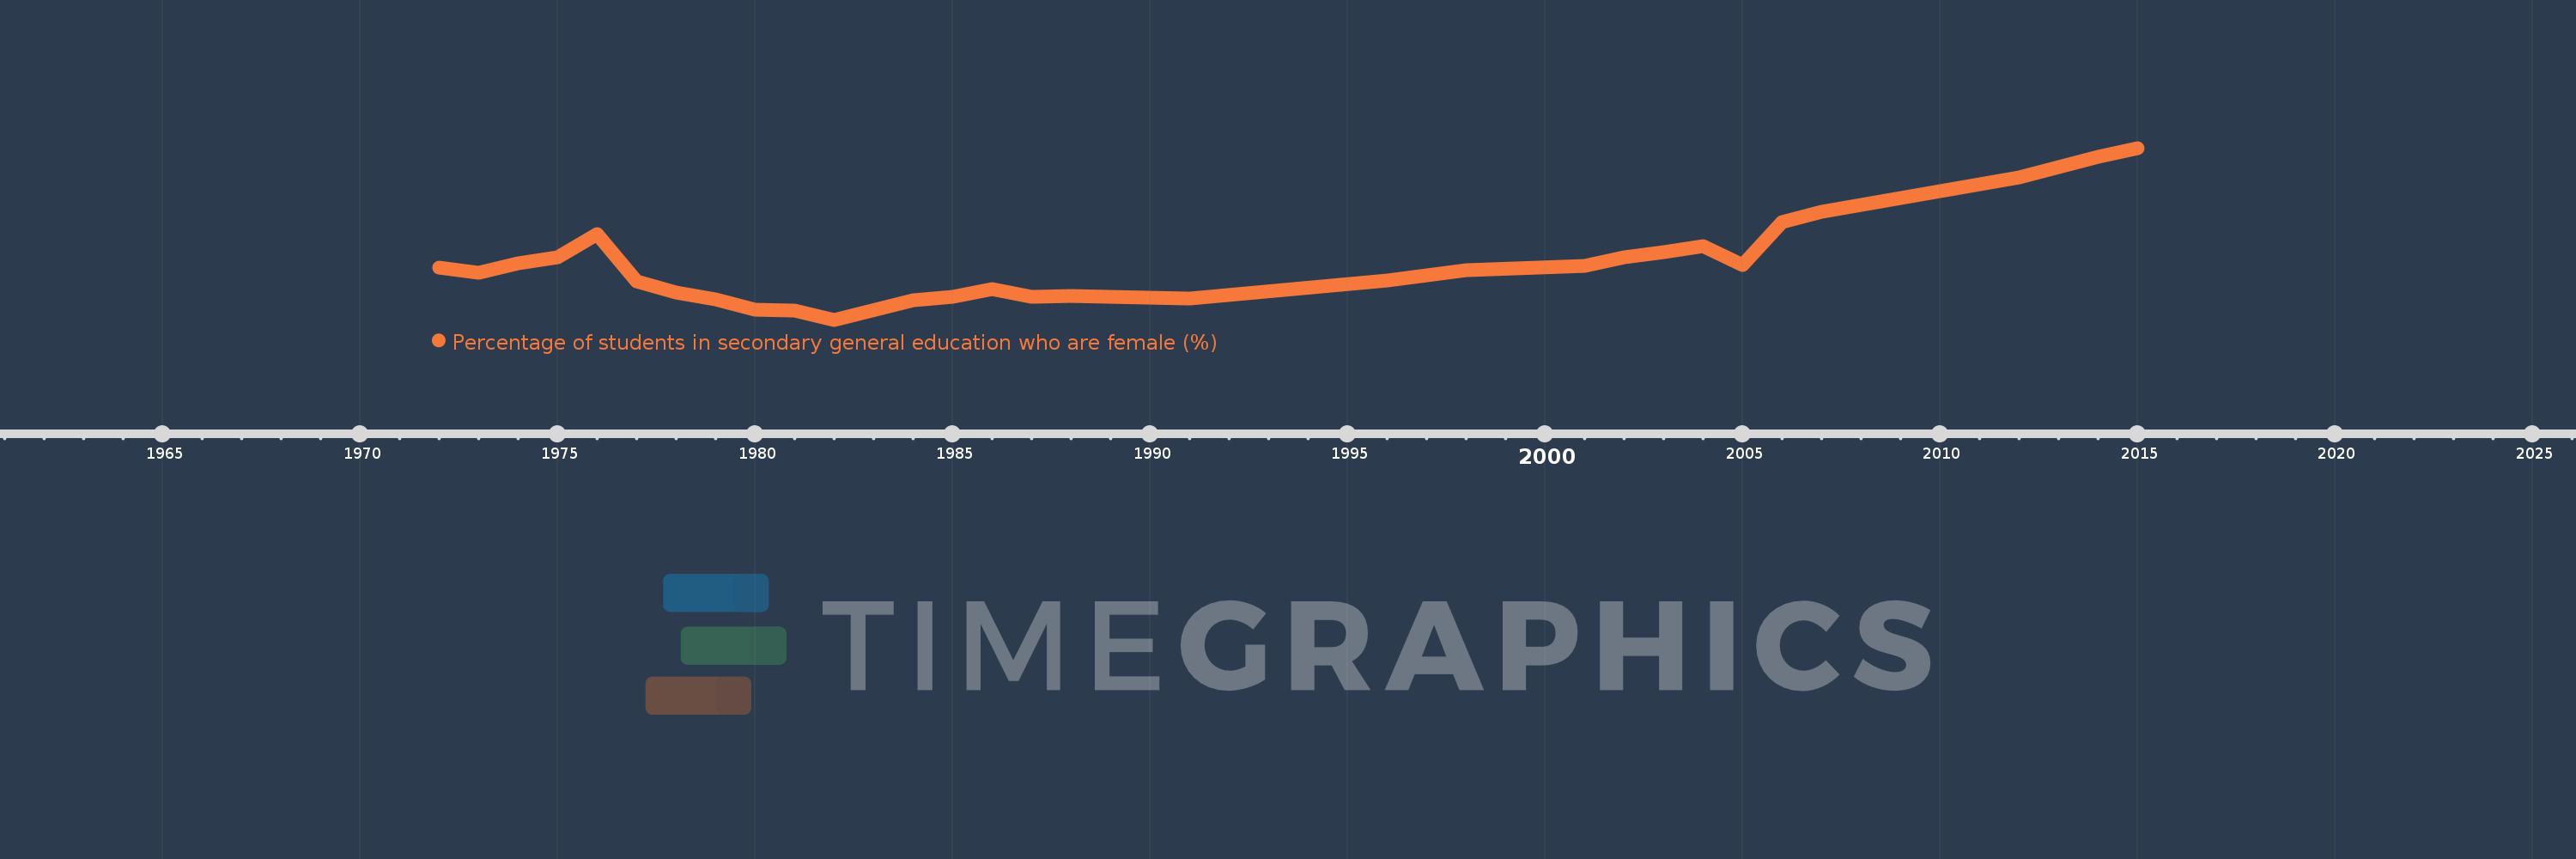
Percentage of students in secondary general education who are female (%)
2015,2014,2012,2007,2006,2005,2004,2003,2002,2001,1998,1997,1996,1991,1988,1987,1986,1985,1984,1982,1981,1980,1979,1978,1977,1976,1975,1974,1973,1972
Estas estadísticas en otros países:
AfghanistanAlbaniaAlgeriaAndorraAngolaAntigua and BarbudaArab WorldArgentinaArmeniaArubaAustraliaAustriaAzerbaijanBahamas, TheBahrainBangladeshBarbadosBelarusBelgiumBelizeBeninBermudaBhutanBoliviaBosnia and HerzegovinaBotswanaBrazilBritish Virgin IslandsBrunei DarussalamBulgariaBurkina FasoBurundiCabo VerdeCambodiaCameroonCanadaCaribbean small statesCayman IslandsCentral African RepublicCentral Europe and the BalticsChadChileChinaColombiaComorosCongo, Dem. Rep.Congo, Rep.Costa RicaCote d'IvoireCroatiaCubaCuracaoCyprusCzech RepublicDenmarkDjiboutiDominicaDominican RepublicEarly-demographic dividendEast Asia & PacificEast Asia & Pacific (excluding high income)East Asia & Pacific (IDA & IBRD countries)EcuadorEgypt, Arab Rep.El SalvadorEquatorial GuineaEritreaEstoniaEthiopiaEuro areaEurope & Central AsiaEurope & Central Asia (excluding high income)Europe & Central Asia (IDA & IBRD countries)European UnionFijiFinlandFragile and conflict affected situationsFranceGabonGambia, TheGeorgiaGermanyGhanaGibraltarGreeceGrenadaGuatemalaGuineaGuinea-BissauGuyanaHaitiHeavily indebted poor countries (HIPC)High incomeHondurasHong Kong SAR, ChinaHungaryIBRD onlyIcelandIDA & IBRD totalIDA blendIDA onlyIDA totalIndiaIndonesiaIran, Islamic Rep.IraqIrelandIsraelItalyJamaicaJapanJordanKazakhstanKenyaKiribatiKorea, Dem. People’s Rep.Korea, Rep.KuwaitKyrgyz RepublicLao PDRLate-demographic dividendLatin America & Caribbean Latin America & Caribbean (excluding high income)Latin America & the Caribbean (IDA & IBRD countries)LatviaLeast developed countries: UN classificationLebanonLesothoLiberiaLibyaLiechtensteinLithuaniaLow & middle incomeLow incomeLower middle incomeLuxembourgMacao SAR, ChinaMacedonia, FYRMadagascarMalawiMalaysiaMaldivesMaliMaltaMarshall IslandsMauritaniaMauritiusMexicoMicronesia, Fed. Sts.Middle East & North AfricaMiddle East & North Africa (excluding high income)Middle East & North Africa (IDA & IBRD countries)Middle incomeMoldovaMonacoMongoliaMontenegroMoroccoMozambiqueMyanmarNamibiaNauruNepalNetherlandsNew ZealandNicaraguaNigerNigeriaNorth AmericaNorwayOECD membersOmanOther small statesPacific island small statesPakistanPalauPanamaPapua New GuineaParaguayPeruPhilippinesPolandPortugalPost-demographic dividendPre-demographic dividendPuerto RicoQatarRomaniaRussian FederationRwandaSamoaSan MarinoSao Tome and PrincipeSaudi ArabiaSenegalSerbiaSeychellesSierra LeoneSingaporeSint Maarten (Dutch part)Slovak RepublicSloveniaSmall statesSolomon IslandsSomaliaSouth AfricaSouth AsiaSouth Asia (IDA & IBRD)South SudanSpainSri LankaSt. Kitts and NevisSt. LuciaSt. Vincent and the GrenadinesSub-Saharan Africa Sub-Saharan Africa (excluding high income)Sub-Saharan Africa (IDA & IBRD countries)SudanSurinameSwazilandSwedenSwitzerlandSyrian Arab RepublicTajikistanTanzaniaThailandTimor-LesteTogoTongaTrinidad and TobagoTunisiaTurkeyTurkmenistanTurks and Caicos IslandsTuvaluUgandaUkraineUnited Arab EmiratesUnited KingdomUnited StatesUpper middle incomeUruguayUzbekistanVanuatuVenezuela, RBVietnamWest Bank and GazaWorldYemen, Rep.ZambiaZimbabwe línea de tiempo (timeline):
En esta escala de tiempo se presenta un gráfico de 1972 y 2015 de Benin. Los datos de 1971 están ausentes. El número de observaciones reales por fecha: 30.
Fuente (nombre):
Indicadores del desarrollo mundial
Fuente (organización):
UNESCO Institute for Statistics
Categorías:
Education, Gender
Se ha actualizado:
23 abr 2017 año
Los indicadores de los cambios de valor en los últimos años
Mínimo:
26.158
1 ene 1982 año
Máximo:
40.259
1 ene 2015 año
A la fecha de observación
Valor
Cambio absoluto
El cambio con respecto al valor anterior
1 ene 1972 año
30.418
+30.418
0.0%
1 ene 1973 año
30.035
-0.383
-1.26%
1 ene 1974 año
30.769
+0.734
2.44%
1 ene 1975 año
31.254
+0.485
1.58%
1 ene 1976 año
33.194
+1.94
6.21%
1 ene 1977 año
29.331
-3.863
-11.64%
1 ene 1978 año
28.364
-0.967
-3.3%
1 ene 1979 año
27.814
-0.55
-1.94%
1 ene 1980 año
26.951
-0.863
-3.1%
1 ene 1981 año
26.914
-0.037
-0.14%
1 ene 1982 año
26.158
-0.756
-2.81%
1 ene 1984 año
27.767
+1.609
6.15%
1 ene 1985 año
28.02
+0.253
0.91%
1 ene 1986 año
28.687
+0.667
2.38%
1 ene 1987 año
28.007
-0.68
-2.37%
1 ene 1988 año
28.077
+0.069
0.25%
1 ene 1991 año
27.871
-0.206
-0.73%
1 ene 1996 año
29.407
+1.536
5.51%
1 ene 1997 año
29.776
+0.369
1.25%
1 ene 1998 año
30.194
+0.418
1.41%
1 ene 2001 año
30.581
+0.387
1.28%
1 ene 2002 año
31.301
+0.72
2.35%
1 ene 2003 año
31.674
+0.373
1.19%
1 ene 2004 año
32.192
+0.518
1.63%
1 ene 2005 año
30.653
-1.539
-4.78%
1 ene 2006 año
34.198
+3.545
11.56%
1 ene 2007 año
35.029
+0.831
2.43%
1 ene 2012 año
37.855
+2.827
8.07%
1 ene 2014 año
39.54
+1.685
4.45%
1 ene 2015 año
40.259
+0.719
1.82%
Ranking de los países por los datos estadísticos actuales


Comentarios: