30
/es/
AIzaSyAYiBZKx7MnpbEhh9jyipgxe19OcubqV5w
April 1, 2024
252283
St. Vincent and the Grenadines
VCT
true
2
1
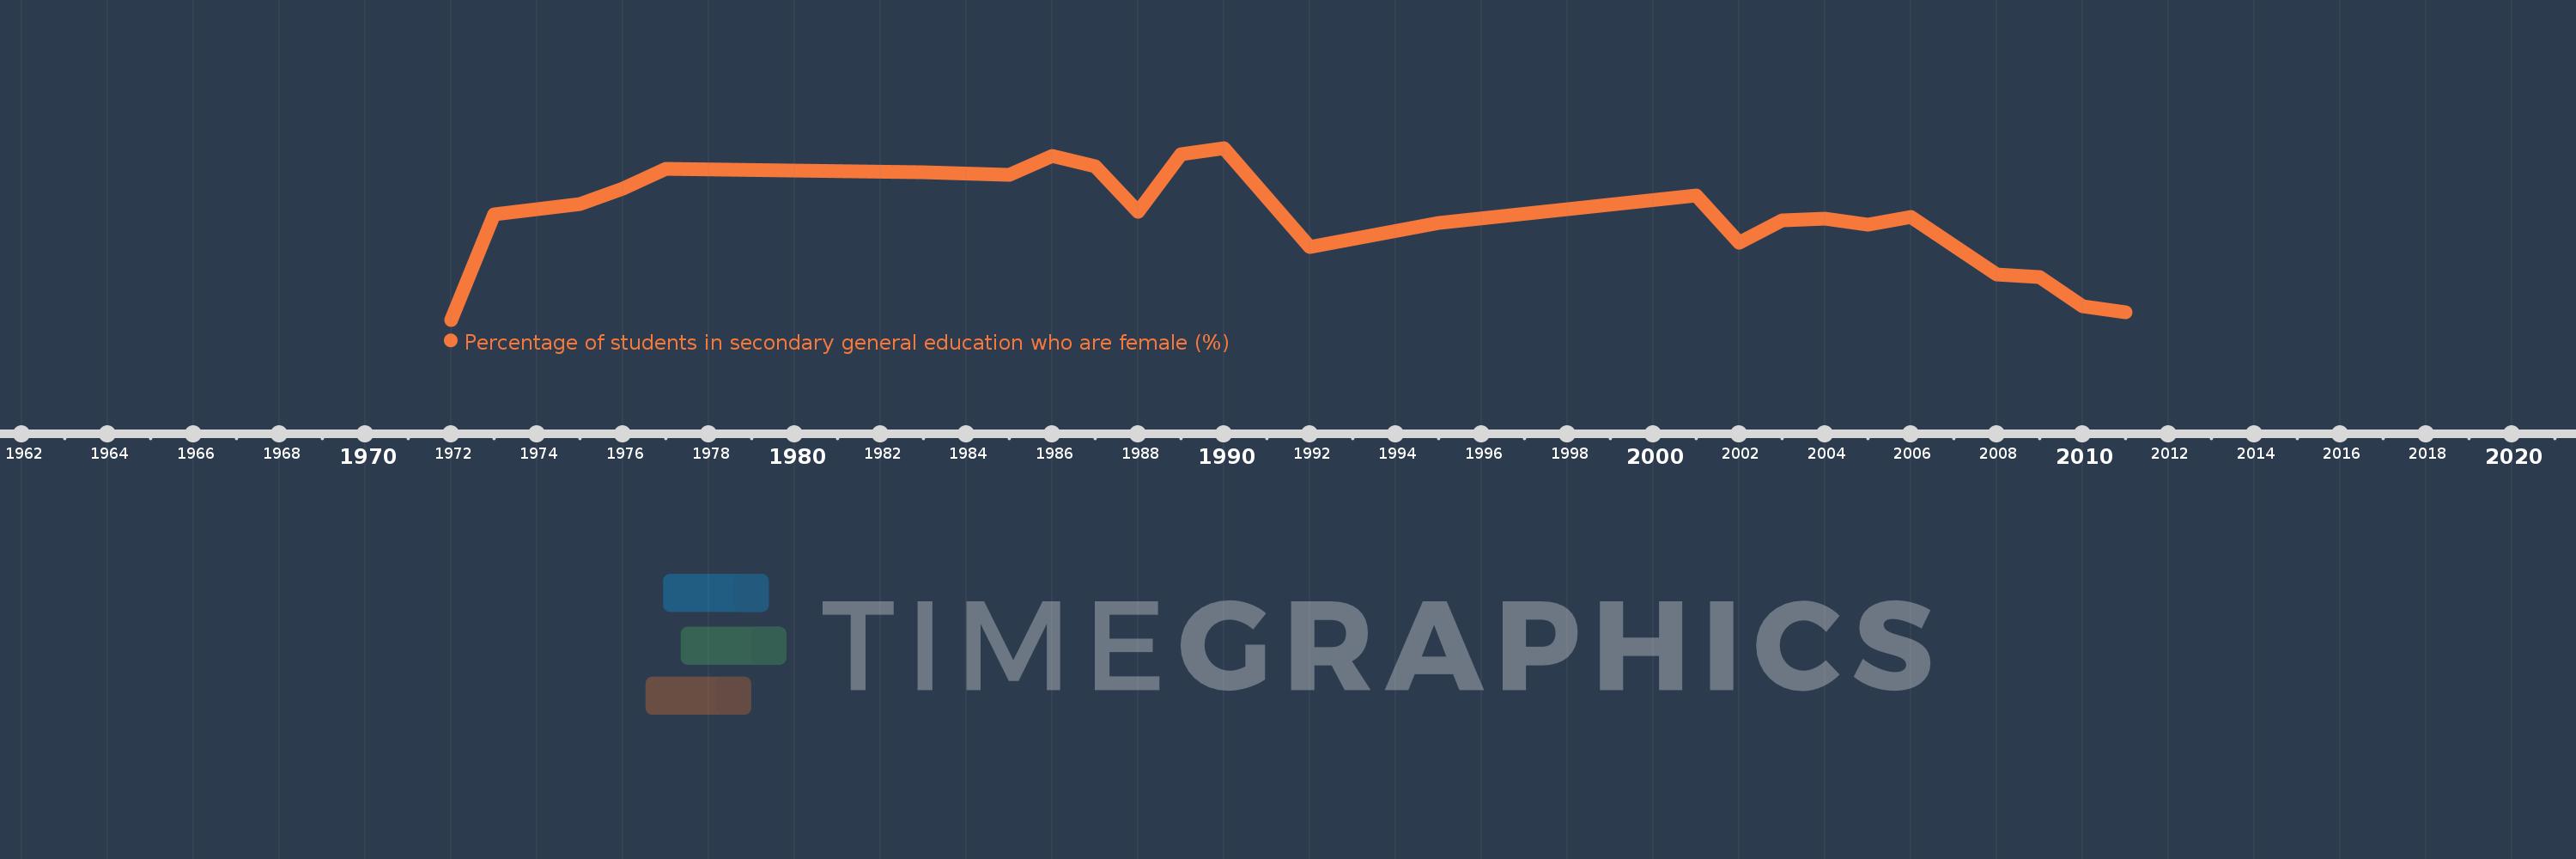
Percentage of students in secondary general education who are female (%)
2011,2010,2009,2008,2006,2005,2004,2003,2002,2001,1995,1992,1990,1989,1988,1987,1986,1985,1983,1977,1976,1975,1973,1972
