29
/es/
es
AIzaSyAYiBZKx7MnpbEhh9jyipgxe19OcubqV5w
April 1, 2024
74275
Austria
AUT
true
2
1
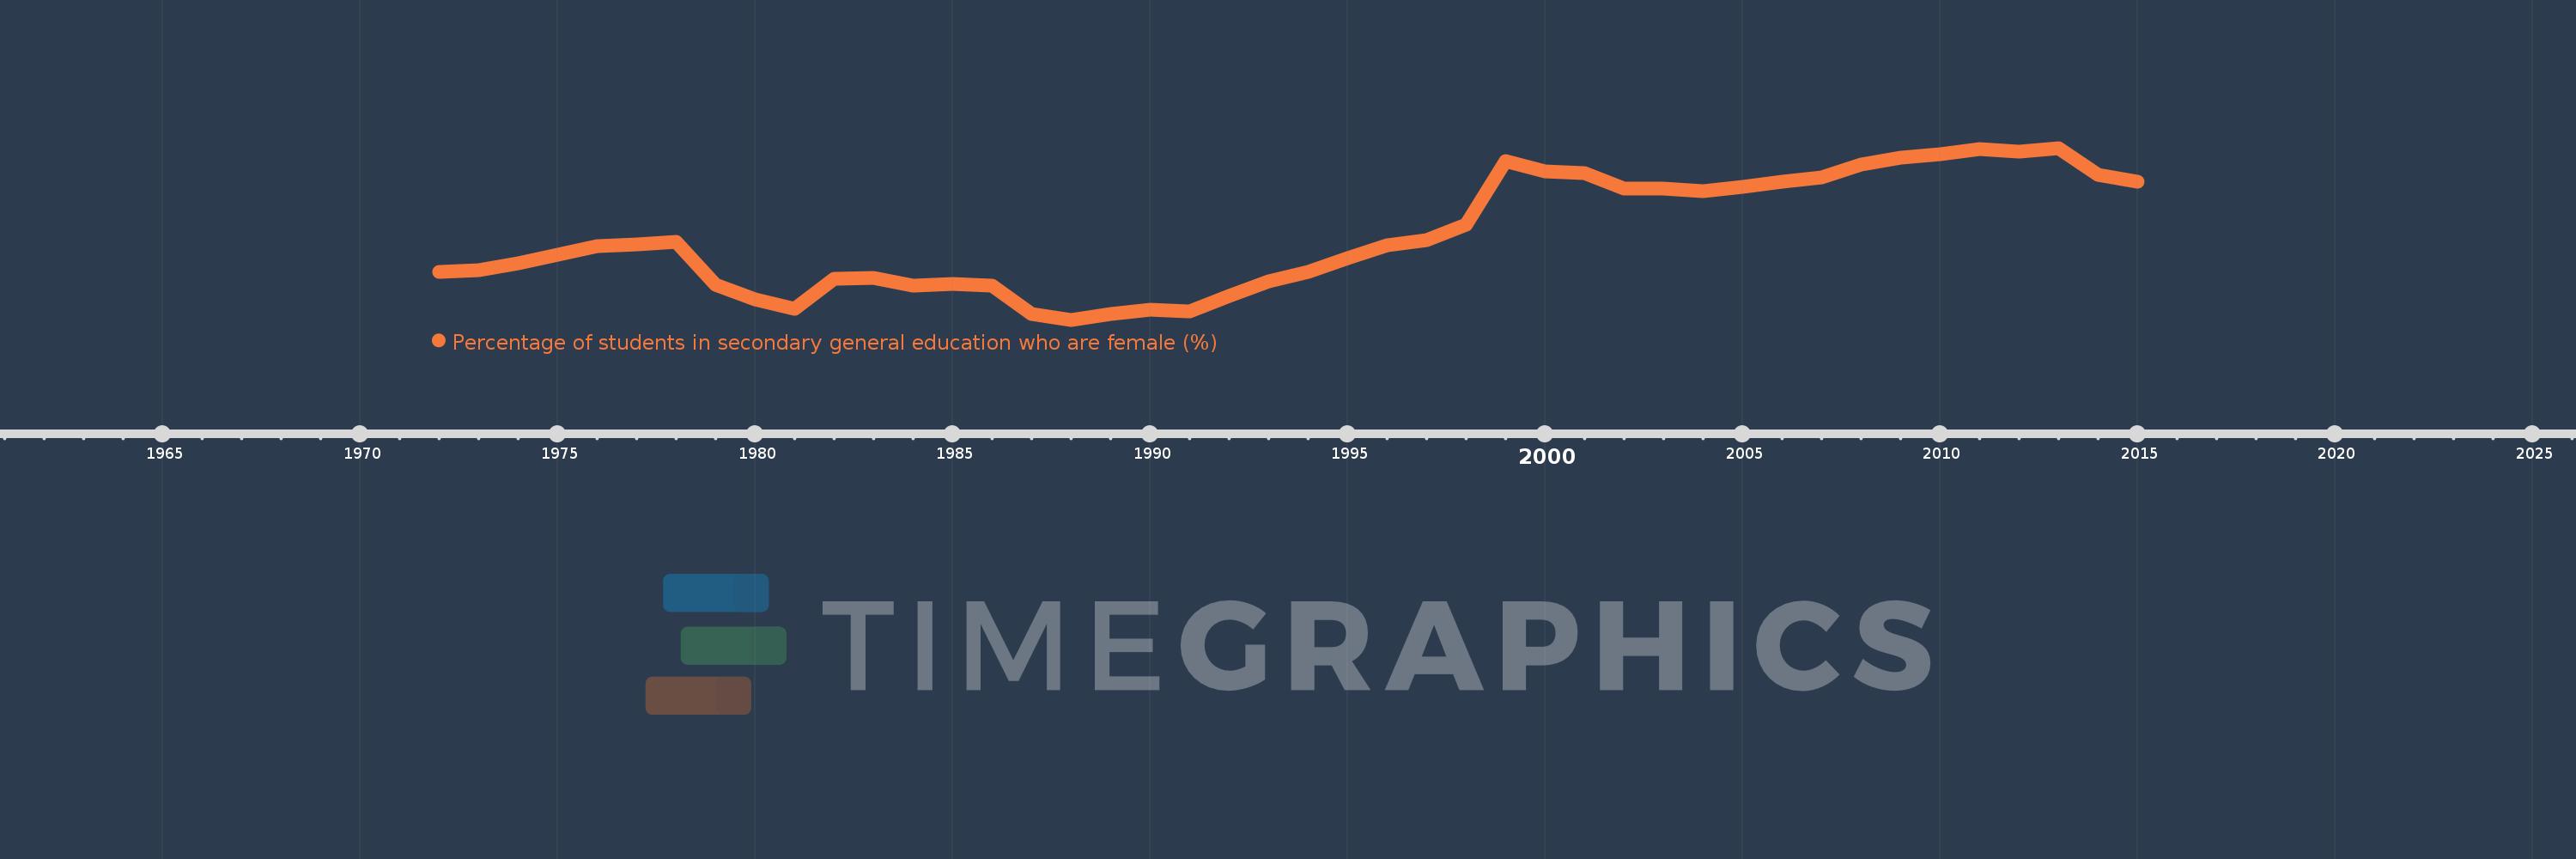
Percentage of students in secondary general education who are female (%)
2015,2014,2013,2012,2011,2010,2009,2008,2007,2006,2005,2004,2003,2002,2001,2000,1999,1998,1997,1996,1995,1994,1993,1992,1991,1990,1989,1988,1987,1986,1985,1984,1983,1982,1981,1980,1979,1978,1977,1976,1975,1974,1973,1972
Estas estadísticas en otros países:
AfghanistanAlbaniaAlgeriaAndorraAngolaAntigua and BarbudaArab WorldArgentinaArmeniaArubaAustraliaAustriaAzerbaijanBahamas, TheBahrainBangladeshBarbadosBelarusBelgiumBelizeBeninBermudaBhutanBoliviaBosnia and HerzegovinaBotswanaBrazilBritish Virgin IslandsBrunei DarussalamBulgariaBurkina FasoBurundiCabo VerdeCambodiaCameroonCanadaCaribbean small statesCayman IslandsCentral African RepublicCentral Europe and the BalticsChadChileChinaColombiaComorosCongo, Dem. Rep.Congo, Rep.Costa RicaCote d'IvoireCroatiaCubaCuracaoCyprusCzech RepublicDenmarkDjiboutiDominicaDominican RepublicEarly-demographic dividendEast Asia & PacificEast Asia & Pacific (excluding high income)East Asia & Pacific (IDA & IBRD countries)EcuadorEgypt, Arab Rep.El SalvadorEquatorial GuineaEritreaEstoniaEthiopiaEuro areaEurope & Central AsiaEurope & Central Asia (excluding high income)Europe & Central Asia (IDA & IBRD countries)European UnionFijiFinlandFragile and conflict affected situationsFranceGabonGambia, TheGeorgiaGermanyGhanaGibraltarGreeceGrenadaGuatemalaGuineaGuinea-BissauGuyanaHaitiHeavily indebted poor countries (HIPC)High incomeHondurasHong Kong SAR, ChinaHungaryIBRD onlyIcelandIDA & IBRD totalIDA blendIDA onlyIDA totalIndiaIndonesiaIran, Islamic Rep.IraqIrelandIsraelItalyJamaicaJapanJordanKazakhstanKenyaKiribatiKorea, Dem. People’s Rep.Korea, Rep.KuwaitKyrgyz RepublicLao PDRLate-demographic dividendLatin America & Caribbean Latin America & Caribbean (excluding high income)Latin America & the Caribbean (IDA & IBRD countries)LatviaLeast developed countries: UN classificationLebanonLesothoLiberiaLibyaLiechtensteinLithuaniaLow & middle incomeLow incomeLower middle incomeLuxembourgMacao SAR, ChinaMacedonia, FYRMadagascarMalawiMalaysiaMaldivesMaliMaltaMarshall IslandsMauritaniaMauritiusMexicoMicronesia, Fed. Sts.Middle East & North AfricaMiddle East & North Africa (excluding high income)Middle East & North Africa (IDA & IBRD countries)Middle incomeMoldovaMonacoMongoliaMontenegroMoroccoMozambiqueMyanmarNamibiaNauruNepalNetherlandsNew ZealandNicaraguaNigerNigeriaNorth AmericaNorwayOECD membersOmanOther small statesPacific island small statesPakistanPalauPanamaPapua New GuineaParaguayPeruPhilippinesPolandPortugalPost-demographic dividendPre-demographic dividendPuerto RicoQatarRomaniaRussian FederationRwandaSamoaSan MarinoSao Tome and PrincipeSaudi ArabiaSenegalSerbiaSeychellesSierra LeoneSingaporeSint Maarten (Dutch part)Slovak RepublicSloveniaSmall statesSolomon IslandsSomaliaSouth AfricaSouth AsiaSouth Asia (IDA & IBRD)South SudanSpainSri LankaSt. Kitts and NevisSt. LuciaSt. Vincent and the GrenadinesSub-Saharan Africa Sub-Saharan Africa (excluding high income)Sub-Saharan Africa (IDA & IBRD countries)SudanSurinameSwazilandSwedenSwitzerlandSyrian Arab RepublicTajikistanTanzaniaThailandTimor-LesteTogoTongaTrinidad and TobagoTunisiaTurkeyTurkmenistanTurks and Caicos IslandsTuvaluUgandaUkraineUnited Arab EmiratesUnited KingdomUnited StatesUpper middle incomeUruguayUzbekistanVanuatuVenezuela, RBVietnamWest Bank and GazaWorldYemen, Rep.ZambiaZimbabwe línea de tiempo (timeline):
En esta escala de tiempo se presenta un gráfico de 1972 y 2015 de Austria. Los datos de 1971 están ausentes. El número de observaciones reales por fecha: 44.
Fuente (nombre):
Indicadores del desarrollo mundial
Fuente (organización):
UNESCO Institute for Statistics
Categorías:
Education, Gender
Se ha actualizado:
23 abr 2017 año
Los indicadores de los cambios de valor en los últimos años
Mínimo:
48.236
1 ene 1988 año
Máximo:
50.289
1 ene 2013 año
A la fecha de observación
Valor
Cambio absoluto
El cambio con respecto al valor anterior
1 ene 1972 año
48.807
+48.807
0.0%
1 ene 1973 año
48.827
+0.019
0.04%
1 ene 1974 año
48.91
+0.083
0.17%
1 ene 1975 año
49.015
+0.105
0.22%
1 ene 1976 año
49.114
+0.099
0.2%
1 ene 1977 año
49.14
+0.026
0.05%
1 ene 1978 año
49.167
+0.027
0.05%
1 ene 1979 año
48.652
-0.514
-1.05%
1 ene 1980 año
48.48
-0.172
-0.35%
1 ene 1981 año
48.37
-0.11
-0.23%
1 ene 1982 año
48.728
+0.358
0.74%
1 ene 1983 año
48.731
+0.003
0.01%
1 ene 1984 año
48.642
-0.089
-0.18%
1 ene 1985 año
48.665
+0.023
0.05%
1 ene 1986 año
48.643
-0.022
-0.05%
1 ene 1987 año
48.309
-0.334
-0.69%
1 ene 1988 año
48.236
-0.073
-0.15%
1 ene 1989 año
48.306
+0.07
0.15%
1 ene 1990 año
48.358
+0.052
0.11%
1 ene 1991 año
48.336
-0.022
-0.05%
1 ene 1992 año
48.521
+0.185
0.38%
1 ene 1993 año
48.695
+0.175
0.36%
1 ene 1994 año
48.803
+0.108
0.22%
1 ene 1995 año
48.968
+0.165
0.34%
1 ene 1996 año
49.13
+0.162
0.33%
1 ene 1997 año
49.186
+0.056
0.11%
1 ene 1998 año
49.369
+0.183
0.37%
1 ene 1999 año
50.134
+0.765
1.55%
1 ene 2000 año
50.012
-0.121
-0.24%
1 ene 2001 año
49.988
-0.024
-0.05%
1 ene 2002 año
49.804
-0.184
-0.37%
1 ene 2003 año
49.799
-0.005
-0.01%
1 ene 2004 año
49.774
-0.025
-0.05%
1 ene 2005 año
49.827
+0.053
0.11%
1 ene 2006 año
49.89
+0.063
0.13%
1 ene 2007 año
49.941
+0.051
0.1%
1 ene 2008 año
50.089
+0.148
0.3%
1 ene 2009 año
50.172
+0.083
0.17%
1 ene 2010 año
50.218
+0.047
0.09%
1 ene 2011 año
50.272
+0.054
0.11%
1 ene 2012 año
50.248
-0.024
-0.05%
1 ene 2013 año
50.289
+0.041
0.08%
1 ene 2014 año
49.965
-0.324
-0.64%
1 ene 2015 año
49.889
-0.077
-0.15%
Ranking de los países por los datos estadísticos actuales


Comentarios: