29
/es/
es
AIzaSyAYiBZKx7MnpbEhh9jyipgxe19OcubqV5w
April 1, 2024
215677
Oman
OMN
true
2
1
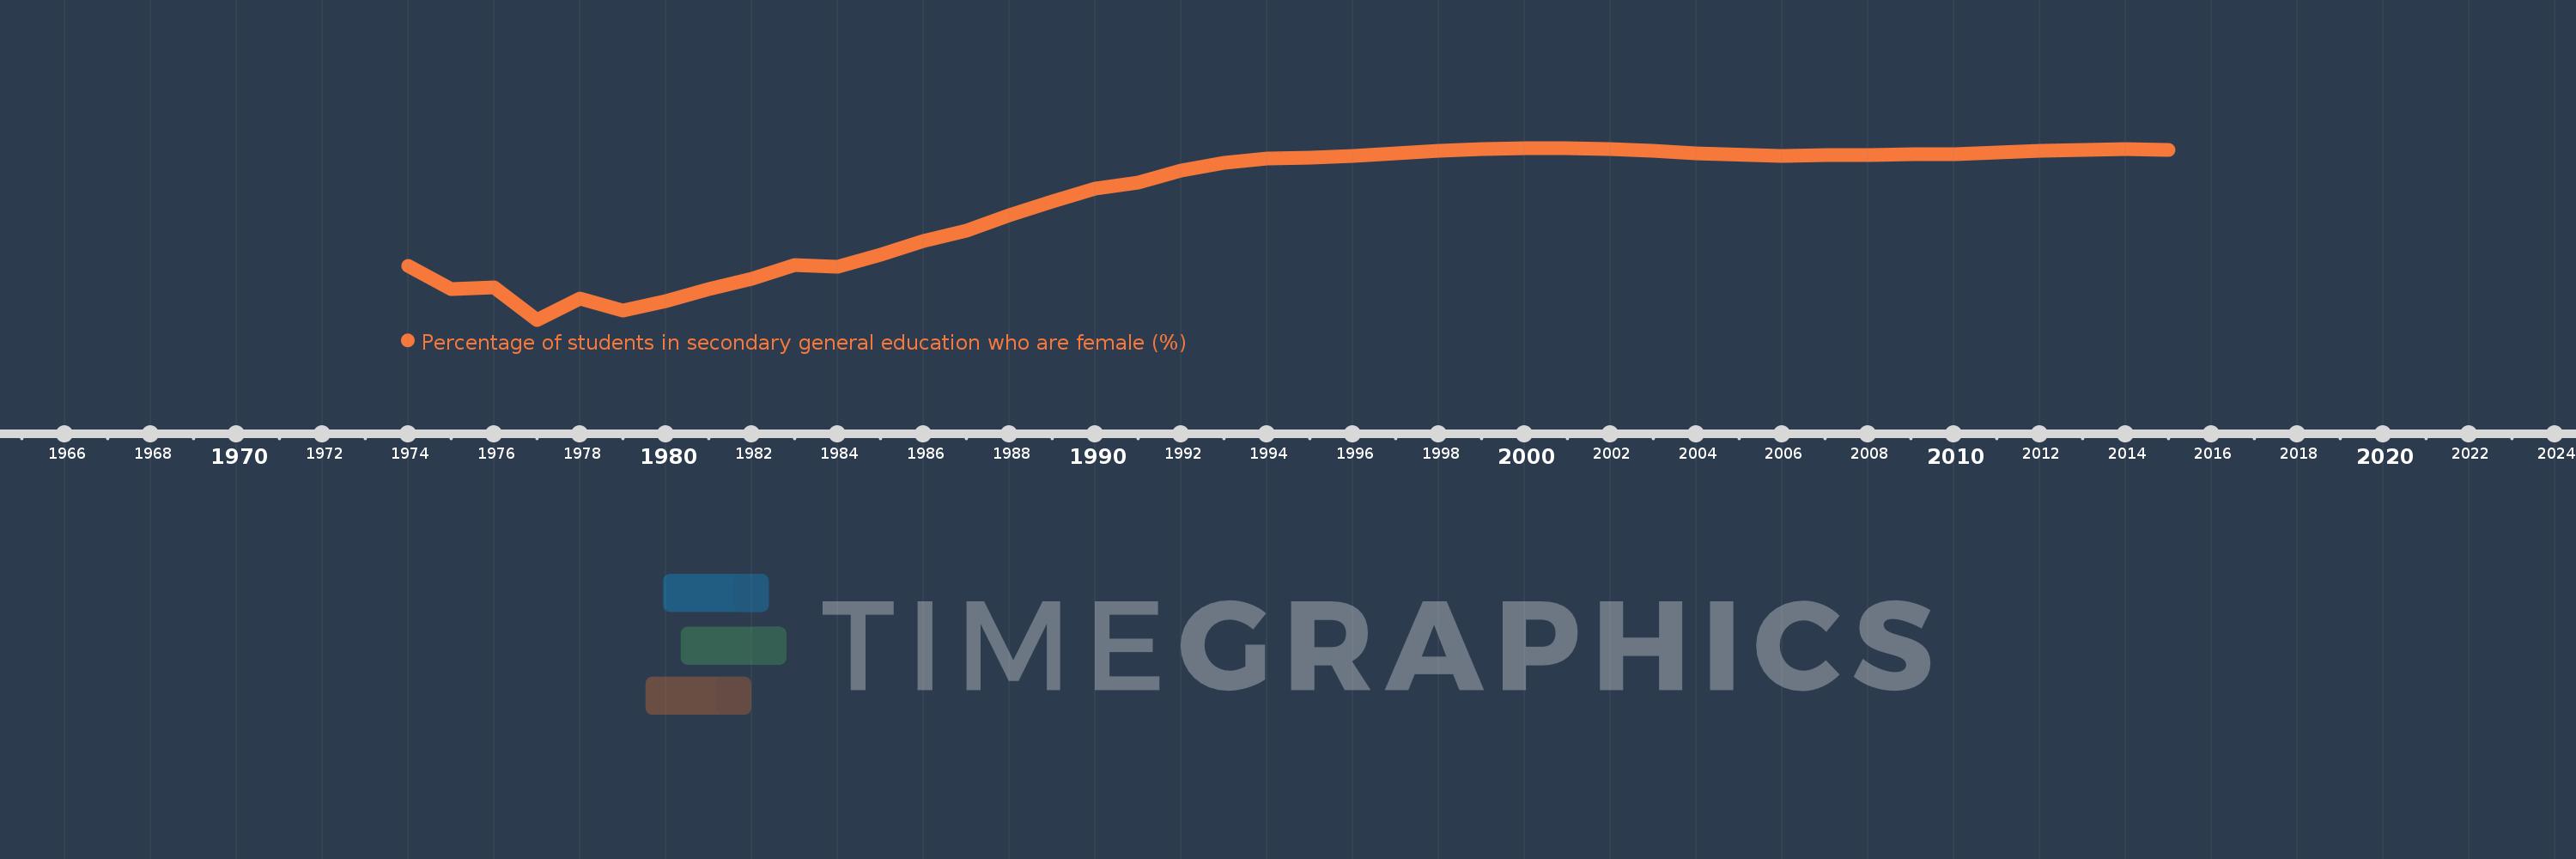
Percentage of students in secondary general education who are female (%)
2015,2014,2013,2012,2010,2009,2008,2007,2006,2004,2003,2002,2001,2000,1999,1998,1997,1996,1995,1994,1993,1992,1991,1990,1989,1988,1987,1986,1985,1984,1983,1982,1981,1980,1979,1978,1977,1976,1975,1974
Estas estadísticas en otros países:
AfghanistanAlbaniaAlgeriaAndorraAngolaAntigua and BarbudaArab WorldArgentinaArmeniaArubaAustraliaAustriaAzerbaijanBahamas, TheBahrainBangladeshBarbadosBelarusBelgiumBelizeBeninBermudaBhutanBoliviaBosnia and HerzegovinaBotswanaBrazilBritish Virgin IslandsBrunei DarussalamBulgariaBurkina FasoBurundiCabo VerdeCambodiaCameroonCanadaCaribbean small statesCayman IslandsCentral African RepublicCentral Europe and the BalticsChadChileChinaColombiaComorosCongo, Dem. Rep.Congo, Rep.Costa RicaCote d'IvoireCroatiaCubaCuracaoCyprusCzech RepublicDenmarkDjiboutiDominicaDominican RepublicEarly-demographic dividendEast Asia & PacificEast Asia & Pacific (excluding high income)East Asia & Pacific (IDA & IBRD countries)EcuadorEgypt, Arab Rep.El SalvadorEquatorial GuineaEritreaEstoniaEthiopiaEuro areaEurope & Central AsiaEurope & Central Asia (excluding high income)Europe & Central Asia (IDA & IBRD countries)European UnionFijiFinlandFragile and conflict affected situationsFranceGabonGambia, TheGeorgiaGermanyGhanaGibraltarGreeceGrenadaGuatemalaGuineaGuinea-BissauGuyanaHaitiHeavily indebted poor countries (HIPC)High incomeHondurasHong Kong SAR, ChinaHungaryIBRD onlyIcelandIDA & IBRD totalIDA blendIDA onlyIDA totalIndiaIndonesiaIran, Islamic Rep.IraqIrelandIsraelItalyJamaicaJapanJordanKazakhstanKenyaKiribatiKorea, Dem. People’s Rep.Korea, Rep.KuwaitKyrgyz RepublicLao PDRLate-demographic dividendLatin America & Caribbean Latin America & Caribbean (excluding high income)Latin America & the Caribbean (IDA & IBRD countries)LatviaLeast developed countries: UN classificationLebanonLesothoLiberiaLibyaLiechtensteinLithuaniaLow & middle incomeLow incomeLower middle incomeLuxembourgMacao SAR, ChinaMacedonia, FYRMadagascarMalawiMalaysiaMaldivesMaliMaltaMarshall IslandsMauritaniaMauritiusMexicoMicronesia, Fed. Sts.Middle East & North AfricaMiddle East & North Africa (excluding high income)Middle East & North Africa (IDA & IBRD countries)Middle incomeMoldovaMonacoMongoliaMontenegroMoroccoMozambiqueMyanmarNamibiaNauruNepalNetherlandsNew ZealandNicaraguaNigerNigeriaNorth AmericaNorwayOECD membersOmanOther small statesPacific island small statesPakistanPalauPanamaPapua New GuineaParaguayPeruPhilippinesPolandPortugalPost-demographic dividendPre-demographic dividendPuerto RicoQatarRomaniaRussian FederationRwandaSamoaSan MarinoSao Tome and PrincipeSaudi ArabiaSenegalSerbiaSeychellesSierra LeoneSingaporeSint Maarten (Dutch part)Slovak RepublicSloveniaSmall statesSolomon IslandsSomaliaSouth AfricaSouth AsiaSouth Asia (IDA & IBRD)South SudanSpainSri LankaSt. Kitts and NevisSt. LuciaSt. Vincent and the GrenadinesSub-Saharan Africa Sub-Saharan Africa (excluding high income)Sub-Saharan Africa (IDA & IBRD countries)SudanSurinameSwazilandSwedenSwitzerlandSyrian Arab RepublicTajikistanTanzaniaThailandTimor-LesteTogoTongaTrinidad and TobagoTunisiaTurkeyTurkmenistanTurks and Caicos IslandsTuvaluUgandaUkraineUnited Arab EmiratesUnited KingdomUnited StatesUpper middle incomeUruguayUzbekistanVanuatuVenezuela, RBVietnamWest Bank and GazaWorldYemen, Rep.ZambiaZimbabwe línea de tiempo (timeline):
En esta escala de tiempo se presenta un gráfico de 1974 y 2015 de Oman. Los datos de 1973 están ausentes. El número de observaciones reales por fecha: 40.
Fuente (nombre):
Indicadores del desarrollo mundial
Fuente (organización):
UNESCO Institute for Statistics
Categorías:
Education, Gender
Se ha actualizado:
23 abr 2017 año
Los indicadores de los cambios de valor en los últimos años
Mínimo:
17.529
1 ene 1977 año
Máximo:
49.144
1 ene 2000 año
A la fecha de observación
Valor
Cambio absoluto
El cambio con respecto al valor anterior
1 ene 1974 año
27.397
+27.397
0.0%
1 ene 1975 año
23.235
-4.162
-15.19%
1 ene 1976 año
23.43
+0.195
0.84%
1 ene 1977 año
17.529
-5.901
-25.19%
1 ene 1978 año
21.45
+3.921
22.37%
1 ene 1979 año
19.172
-2.278
-10.62%
1 ene 1980 año
20.997
+1.825
9.52%
1 ene 1981 año
23.147
+2.15
10.24%
1 ene 1982 año
25.052
+1.905
8.23%
1 ene 1983 año
27.666
+2.613
10.43%
1 ene 1984 año
27.345
-0.32
-1.16%
1 ene 1985 año
29.491
+2.145
7.85%
1 ene 1986 año
31.995
+2.504
8.49%
1 ene 1987 año
33.89
+1.895
5.92%
1 ene 1988 año
36.795
+2.906
8.57%
1 ene 1989 año
39.367
+2.571
6.99%
1 ene 1990 año
41.718
+2.351
5.97%
1 ene 1991 año
42.796
+1.078
2.58%
1 ene 1992 año
44.957
+2.161
5.05%
1 ene 1993 año
46.39
+1.432
3.19%
1 ene 1994 año
47.152
+0.763
1.64%
1 ene 1995 año
47.355
+0.202
0.43%
1 ene 1996 año
47.702
+0.347
0.73%
1 ene 1997 año
48.21
+0.508
1.07%
1 ene 1998 año
48.689
+0.479
0.99%
1 ene 1999 año
48.935
+0.246
0.5%
1 ene 2000 año
49.144
+0.208
0.43%
1 ene 2001 año
49.097
-0.047
-0.1%
1 ene 2002 año
48.917
-0.179
-0.37%
1 ene 2003 año
48.623
-0.294
-0.6%
1 ene 2004 año
48.097
-0.526
-1.08%
1 ene 2006 año
47.686
-0.411
-0.86%
1 ene 2007 año
47.772
+0.086
0.18%
1 ene 2008 año
47.791
+0.019
0.04%
1 ene 2009 año
48.03
+0.239
0.5%
1 ene 2010 año
48.003
-0.027
-0.06%
1 ene 2012 año
48.645
+0.642
1.34%
1 ene 2013 año
48.843
+0.198
0.41%
1 ene 2014 año
48.987
+0.144
0.29%
1 ene 2015 año
48.853
-0.134
-0.27%
Ranking de los países por los datos estadísticos actuales


Comentarios: