30
/es/
AIzaSyAYiBZKx7MnpbEhh9jyipgxe19OcubqV5w
April 1, 2024
278115
Uruguay
URY
true
2
1
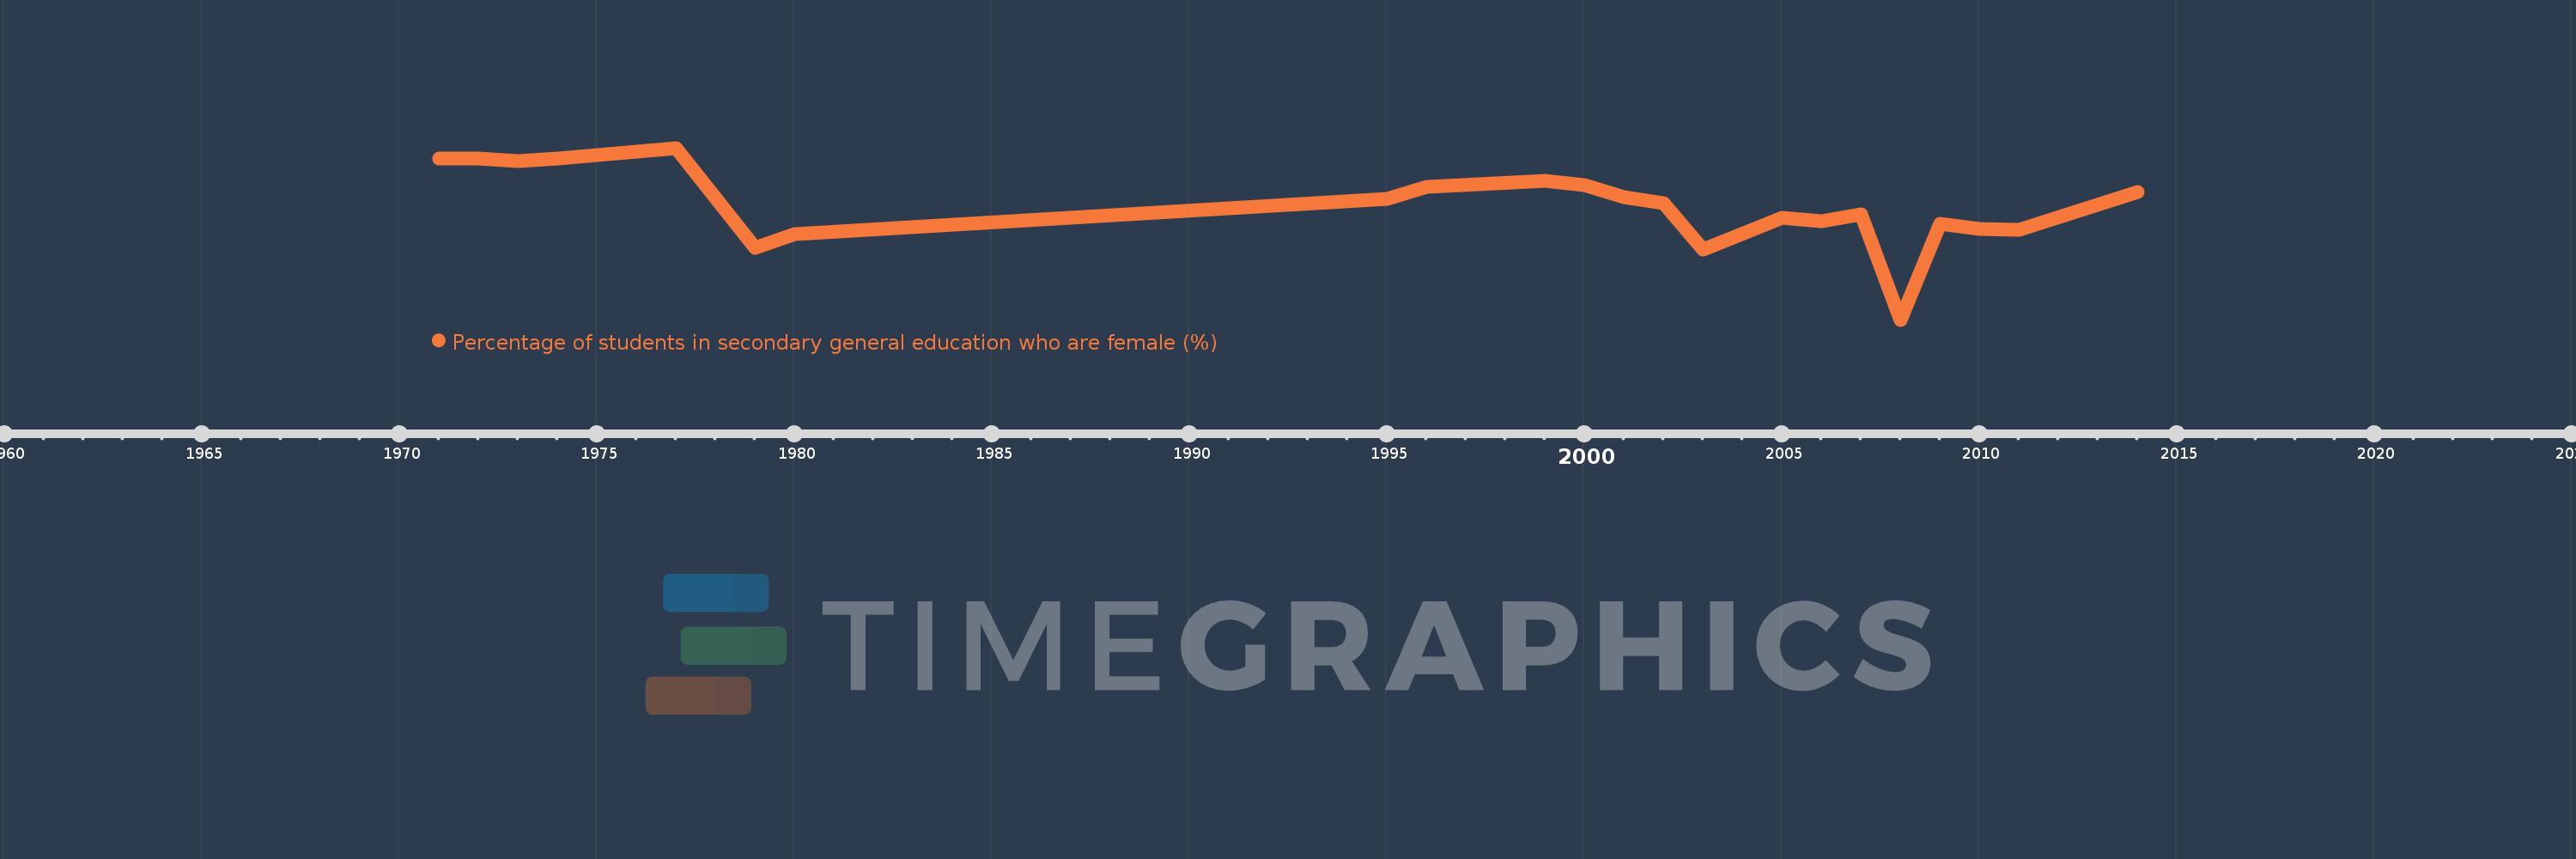
Percentage of students in secondary general education who are female (%)
2014,2011,2010,2009,2008,2007,2006,2005,2003,2002,2001,2000,1999,1996,1995,1980,1979,1977,1974,1973,1972,1971
