29
/es/
es
AIzaSyAYiBZKx7MnpbEhh9jyipgxe19OcubqV5w
April 1, 2024
258769
Syrian Arab Republic
SYR
true
2
1
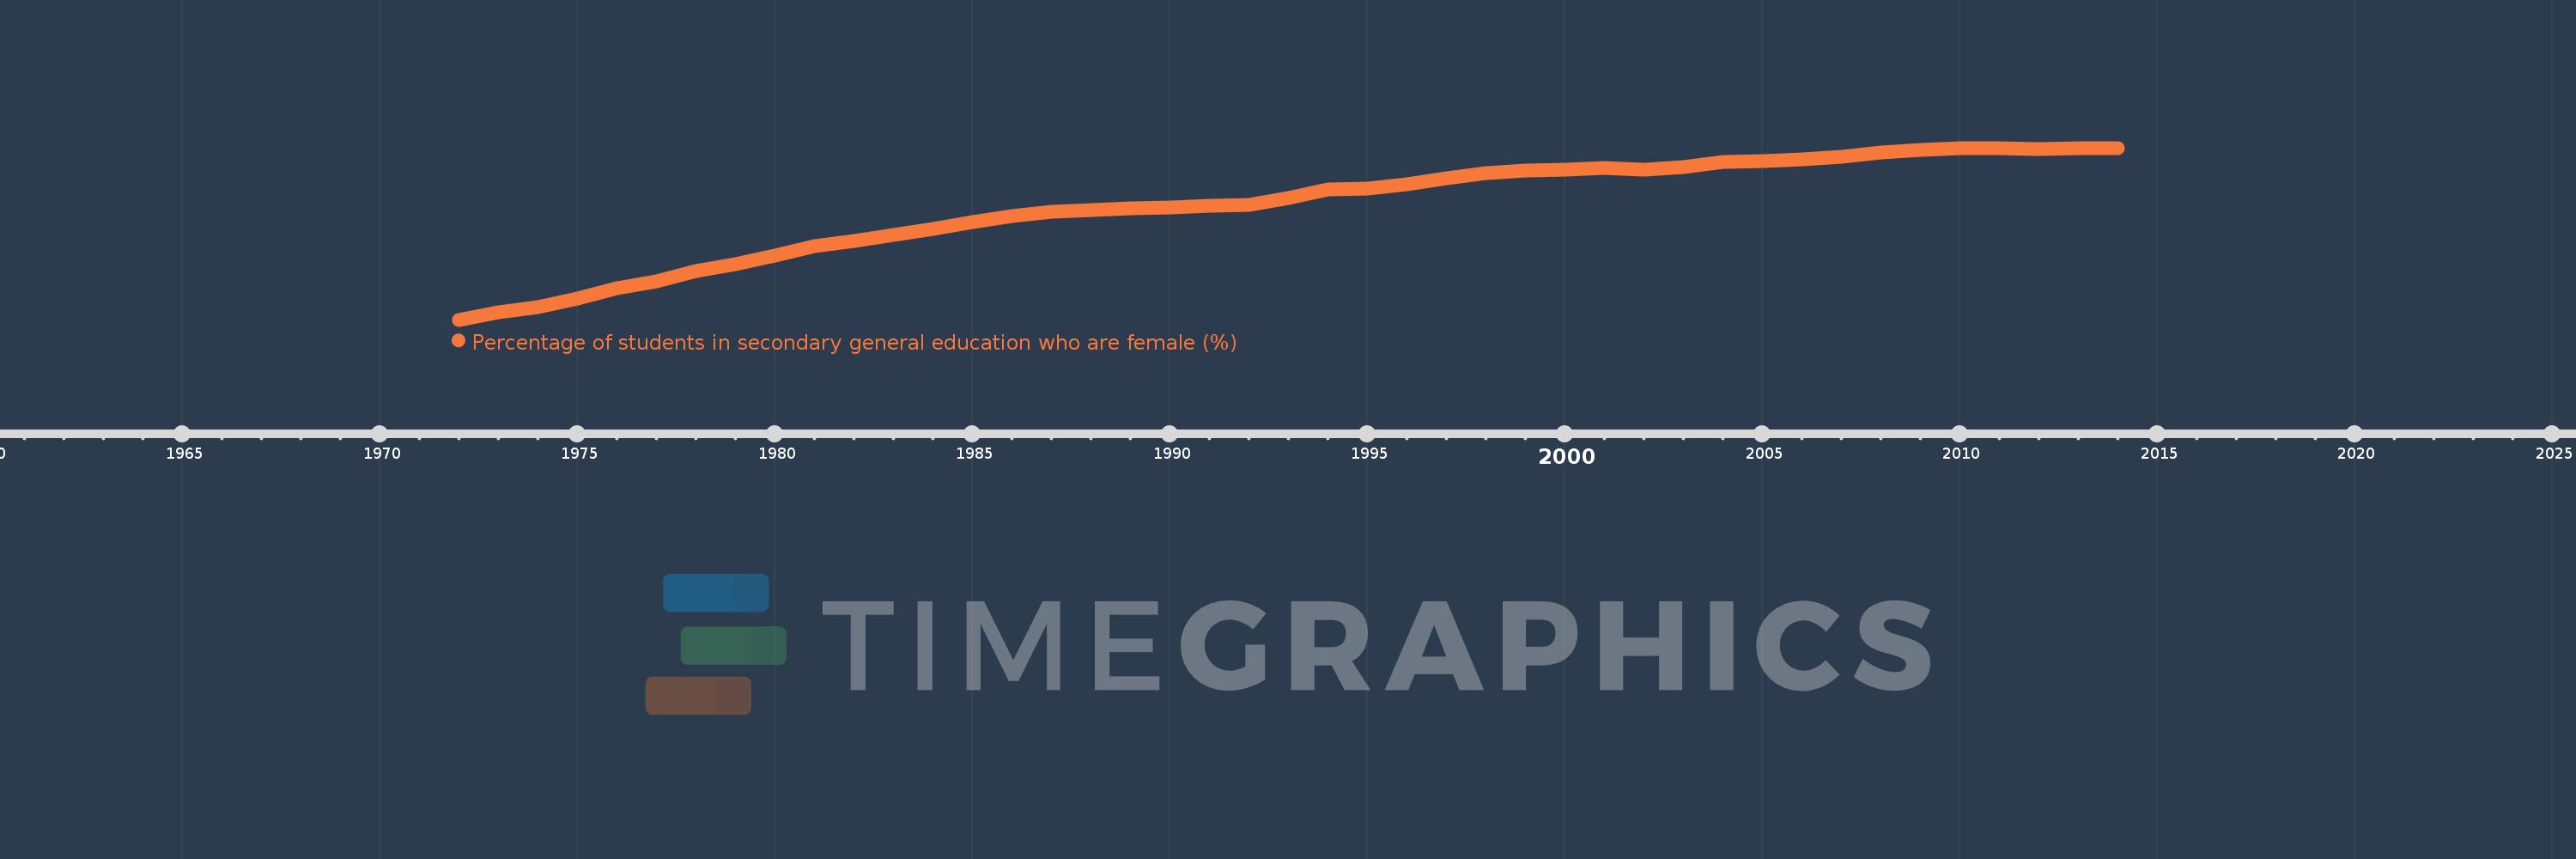
Percentage of students in secondary general education who are female (%)
2014,2013,2012,2011,2010,2009,2008,2007,2006,2005,2004,2003,2002,2001,2000,1999,1998,1997,1996,1995,1994,1993,1992,1991,1990,1989,1988,1987,1986,1985,1984,1983,1982,1981,1980,1979,1978,1977,1976,1975,1974,1973,1972
Estas estadísticas en otros países:
AfghanistanAlbaniaAlgeriaAndorraAngolaAntigua and BarbudaArab WorldArgentinaArmeniaArubaAustraliaAustriaAzerbaijanBahamas, TheBahrainBangladeshBarbadosBelarusBelgiumBelizeBeninBermudaBhutanBoliviaBosnia and HerzegovinaBotswanaBrazilBritish Virgin IslandsBrunei DarussalamBulgariaBurkina FasoBurundiCabo VerdeCambodiaCameroonCanadaCaribbean small statesCayman IslandsCentral African RepublicCentral Europe and the BalticsChadChileChinaColombiaComorosCongo, Dem. Rep.Congo, Rep.Costa RicaCote d'IvoireCroatiaCubaCuracaoCyprusCzech RepublicDenmarkDjiboutiDominicaDominican RepublicEarly-demographic dividendEast Asia & PacificEast Asia & Pacific (excluding high income)East Asia & Pacific (IDA & IBRD countries)EcuadorEgypt, Arab Rep.El SalvadorEquatorial GuineaEritreaEstoniaEthiopiaEuro areaEurope & Central AsiaEurope & Central Asia (excluding high income)Europe & Central Asia (IDA & IBRD countries)European UnionFijiFinlandFragile and conflict affected situationsFranceGabonGambia, TheGeorgiaGermanyGhanaGibraltarGreeceGrenadaGuatemalaGuineaGuinea-BissauGuyanaHaitiHeavily indebted poor countries (HIPC)High incomeHondurasHong Kong SAR, ChinaHungaryIBRD onlyIcelandIDA & IBRD totalIDA blendIDA onlyIDA totalIndiaIndonesiaIran, Islamic Rep.IraqIrelandIsraelItalyJamaicaJapanJordanKazakhstanKenyaKiribatiKorea, Dem. People’s Rep.Korea, Rep.KuwaitKyrgyz RepublicLao PDRLate-demographic dividendLatin America & Caribbean Latin America & Caribbean (excluding high income)Latin America & the Caribbean (IDA & IBRD countries)LatviaLeast developed countries: UN classificationLebanonLesothoLiberiaLibyaLiechtensteinLithuaniaLow & middle incomeLow incomeLower middle incomeLuxembourgMacao SAR, ChinaMacedonia, FYRMadagascarMalawiMalaysiaMaldivesMaliMaltaMarshall IslandsMauritaniaMauritiusMexicoMicronesia, Fed. Sts.Middle East & North AfricaMiddle East & North Africa (excluding high income)Middle East & North Africa (IDA & IBRD countries)Middle incomeMoldovaMonacoMongoliaMontenegroMoroccoMozambiqueMyanmarNamibiaNauruNepalNetherlandsNew ZealandNicaraguaNigerNigeriaNorth AmericaNorwayOECD membersOmanOther small statesPacific island small statesPakistanPalauPanamaPapua New GuineaParaguayPeruPhilippinesPolandPortugalPost-demographic dividendPre-demographic dividendPuerto RicoQatarRomaniaRussian FederationRwandaSamoaSan MarinoSao Tome and PrincipeSaudi ArabiaSenegalSerbiaSeychellesSierra LeoneSingaporeSint Maarten (Dutch part)Slovak RepublicSloveniaSmall statesSolomon IslandsSomaliaSouth AfricaSouth AsiaSouth Asia (IDA & IBRD)South SudanSpainSri LankaSt. Kitts and NevisSt. LuciaSt. Vincent and the GrenadinesSub-Saharan Africa Sub-Saharan Africa (excluding high income)Sub-Saharan Africa (IDA & IBRD countries)SudanSurinameSwazilandSwedenSwitzerlandSyrian Arab RepublicTajikistanTanzaniaThailandTimor-LesteTogoTongaTrinidad and TobagoTunisiaTurkeyTurkmenistanTurks and Caicos IslandsTuvaluUgandaUkraineUnited Arab EmiratesUnited KingdomUnited StatesUpper middle incomeUruguayUzbekistanVanuatuVenezuela, RBVietnamWest Bank and GazaWorldYemen, Rep.ZambiaZimbabwe línea de tiempo (timeline):
En esta escala de tiempo se presenta un gráfico de 1972 y 2014 de Syrian Arab Republic. Los datos de 1971 están ausentes. El número de observaciones reales por fecha: 43.
Fuente (nombre):
Indicadores del desarrollo mundial
Fuente (organización):
UNESCO Institute for Statistics
Categorías:
Education, Gender
Se ha actualizado:
23 abr 2017 año
Los indicadores de los cambios de valor en los últimos años
Mínimo:
26.653
1 ene 1972 año
Máximo:
49.082
1 ene 2013 año
A la fecha de observación
Valor
Cambio absoluto
El cambio con respecto al valor anterior
1 ene 1972 año
26.653
+26.653
0.0%
1 ene 1973 año
27.666
+1.013
3.8%
1 ene 1974 año
28.323
+0.657
2.38%
1 ene 1975 año
29.414
+1.091
3.85%
1 ene 1976 año
30.769
+1.355
4.61%
1 ene 1977 año
31.709
+0.94
3.06%
1 ene 1978 año
33.006
+1.297
4.09%
1 ene 1979 año
33.932
+0.926
2.81%
1 ene 1980 año
34.997
+1.065
3.14%
1 ene 1981 año
36.238
+1.242
3.55%
1 ene 1982 año
36.912
+0.673
1.86%
1 ene 1983 año
37.67
+0.758
2.05%
1 ene 1984 año
38.517
+0.847
2.25%
1 ene 1985 año
39.39
+0.873
2.27%
1 ene 1986 año
40.241
+0.851
2.16%
1 ene 1987 año
40.796
+0.555
1.38%
1 ene 1988 año
40.93
+0.134
0.33%
1 ene 1989 año
41.24
+0.31
0.76%
1 ene 1990 año
41.327
+0.087
0.21%
1 ene 1991 año
41.538
+0.211
0.51%
1 ene 1992 año
41.635
+0.097
0.23%
1 ene 1993 año
42.599
+0.964
2.31%
1 ene 1994 año
43.712
+1.113
2.61%
1 ene 1995 año
43.825
+0.113
0.26%
1 ene 1996 año
44.358
+0.534
1.22%
1 ene 1997 año
45.083
+0.724
1.63%
1 ene 1998 año
45.779
+0.697
1.55%
1 ene 1999 año
46.103
+0.324
0.71%
1 ene 2000 año
46.215
+0.112
0.24%
1 ene 2001 año
46.433
+0.218
0.47%
1 ene 2002 año
46.229
-0.204
-0.44%
1 ene 2003 año
46.631
+0.402
0.87%
1 ene 2004 año
47.274
+0.643
1.38%
1 ene 2005 año
47.415
+0.141
0.3%
1 ene 2006 año
47.603
+0.188
0.4%
1 ene 2007 año
47.962
+0.358
0.75%
1 ene 2008 año
48.528
+0.566
1.18%
1 ene 2009 año
48.815
+0.286
0.59%
1 ene 2010 año
49.026
+0.211
0.43%
1 ene 2011 año
49.033
+0.007
0.01%
1 ene 2012 año
48.965
-0.067
-0.14%
1 ene 2013 año
49.082
+0.117
0.24%
1 ene 2014 año
49.027
-0.056
-0.11%
Ranking de los países por los datos estadísticos actuales


Comentarios: