29
/es/
es
AIzaSyAYiBZKx7MnpbEhh9jyipgxe19OcubqV5w
April 1, 2024
112730
Costa Rica
CRI
true
2
1
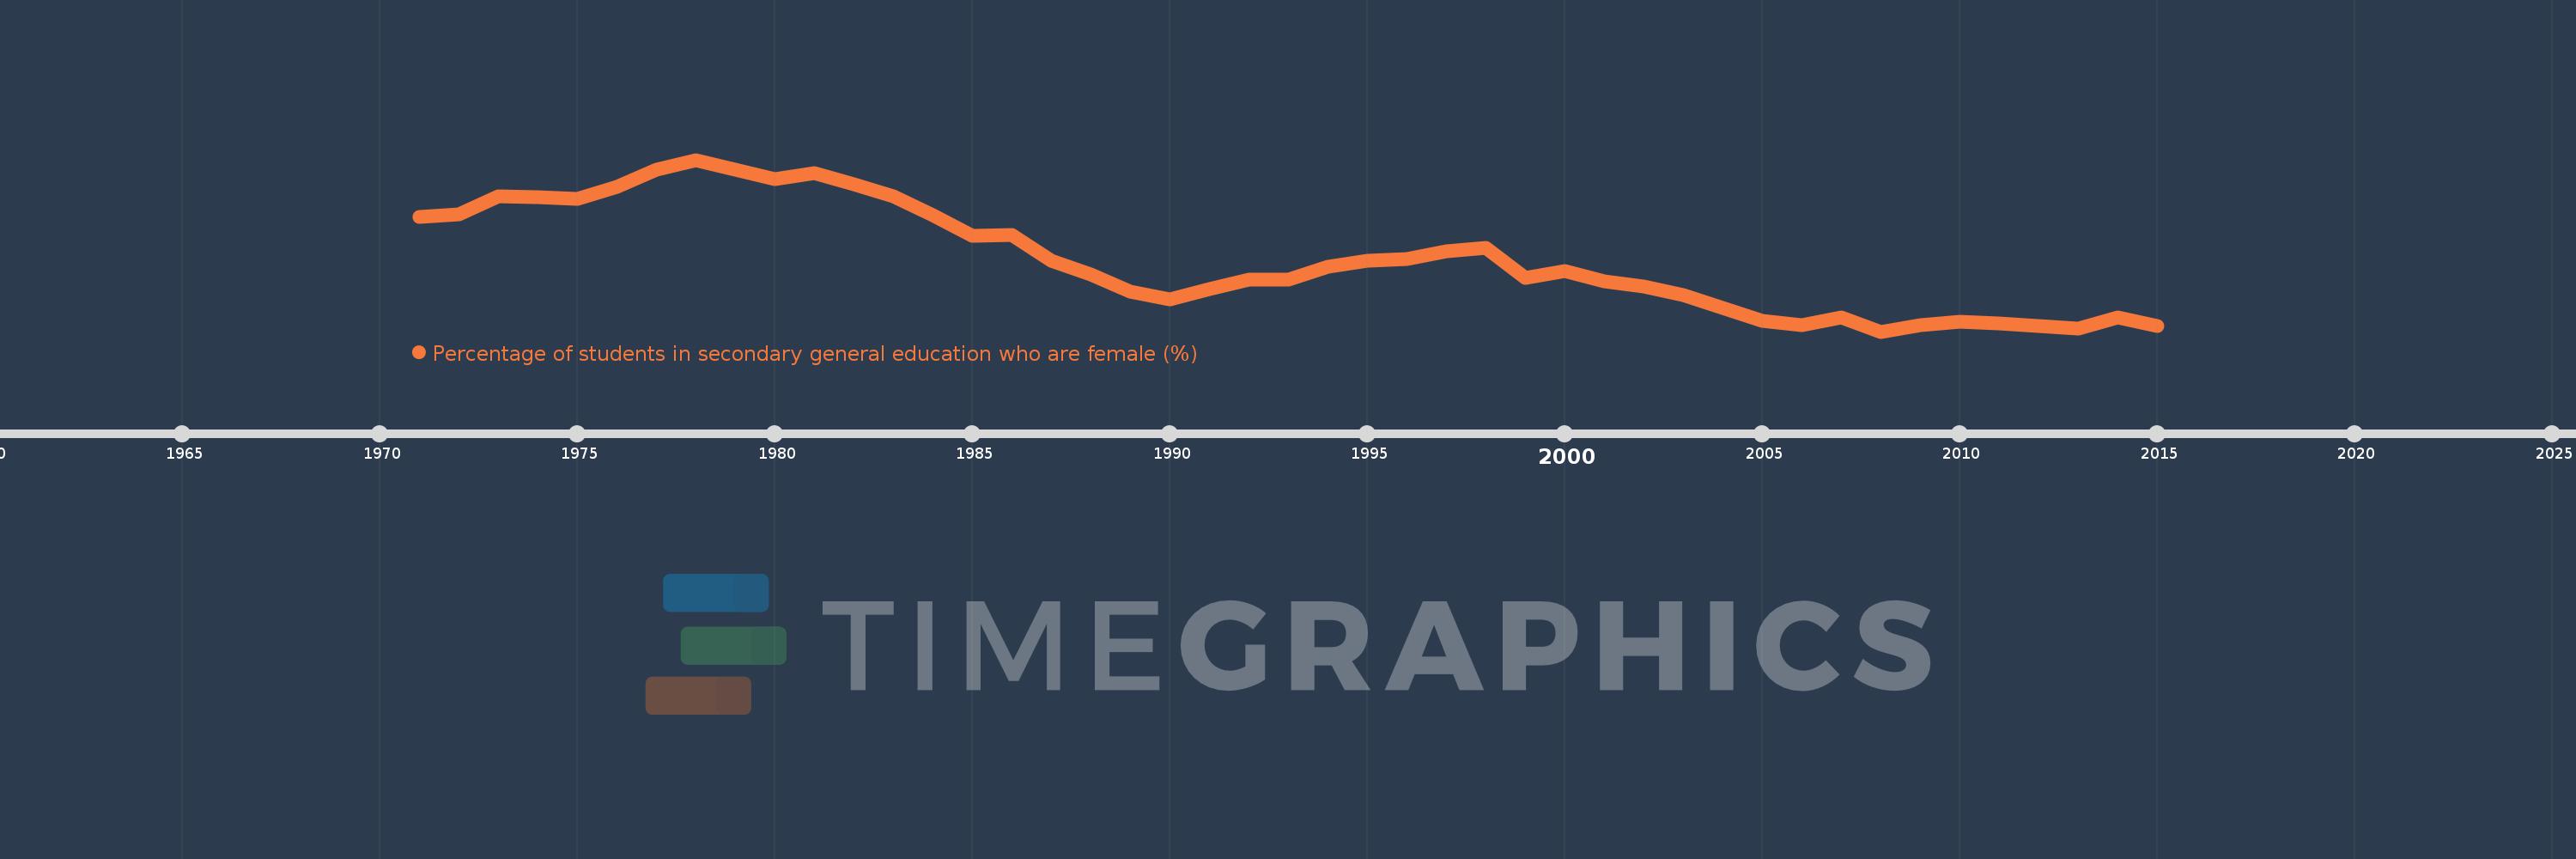
Percentage of students in secondary general education who are female (%)
2015,2014,2013,2012,2011,2010,2009,2008,2007,2006,2005,2003,2002,2001,2000,1999,1998,1997,1996,1995,1994,1993,1992,1991,1990,1989,1988,1987,1986,1985,1984,1983,1982,1981,1980,1978,1977,1976,1975,1974,1973,1972,1971
Estas estadísticas en otros países:
AfghanistanAlbaniaAlgeriaAndorraAngolaAntigua and BarbudaArab WorldArgentinaArmeniaArubaAustraliaAustriaAzerbaijanBahamas, TheBahrainBangladeshBarbadosBelarusBelgiumBelizeBeninBermudaBhutanBoliviaBosnia and HerzegovinaBotswanaBrazilBritish Virgin IslandsBrunei DarussalamBulgariaBurkina FasoBurundiCabo VerdeCambodiaCameroonCanadaCaribbean small statesCayman IslandsCentral African RepublicCentral Europe and the BalticsChadChileChinaColombiaComorosCongo, Dem. Rep.Congo, Rep.Costa RicaCote d'IvoireCroatiaCubaCuracaoCyprusCzech RepublicDenmarkDjiboutiDominicaDominican RepublicEarly-demographic dividendEast Asia & PacificEast Asia & Pacific (excluding high income)East Asia & Pacific (IDA & IBRD countries)EcuadorEgypt, Arab Rep.El SalvadorEquatorial GuineaEritreaEstoniaEthiopiaEuro areaEurope & Central AsiaEurope & Central Asia (excluding high income)Europe & Central Asia (IDA & IBRD countries)European UnionFijiFinlandFragile and conflict affected situationsFranceGabonGambia, TheGeorgiaGermanyGhanaGibraltarGreeceGrenadaGuatemalaGuineaGuinea-BissauGuyanaHaitiHeavily indebted poor countries (HIPC)High incomeHondurasHong Kong SAR, ChinaHungaryIBRD onlyIcelandIDA & IBRD totalIDA blendIDA onlyIDA totalIndiaIndonesiaIran, Islamic Rep.IraqIrelandIsraelItalyJamaicaJapanJordanKazakhstanKenyaKiribatiKorea, Dem. People’s Rep.Korea, Rep.KuwaitKyrgyz RepublicLao PDRLate-demographic dividendLatin America & Caribbean Latin America & Caribbean (excluding high income)Latin America & the Caribbean (IDA & IBRD countries)LatviaLeast developed countries: UN classificationLebanonLesothoLiberiaLibyaLiechtensteinLithuaniaLow & middle incomeLow incomeLower middle incomeLuxembourgMacao SAR, ChinaMacedonia, FYRMadagascarMalawiMalaysiaMaldivesMaliMaltaMarshall IslandsMauritaniaMauritiusMexicoMicronesia, Fed. Sts.Middle East & North AfricaMiddle East & North Africa (excluding high income)Middle East & North Africa (IDA & IBRD countries)Middle incomeMoldovaMonacoMongoliaMontenegroMoroccoMozambiqueMyanmarNamibiaNauruNepalNetherlandsNew ZealandNicaraguaNigerNigeriaNorth AmericaNorwayOECD membersOmanOther small statesPacific island small statesPakistanPalauPanamaPapua New GuineaParaguayPeruPhilippinesPolandPortugalPost-demographic dividendPre-demographic dividendPuerto RicoQatarRomaniaRussian FederationRwandaSamoaSan MarinoSao Tome and PrincipeSaudi ArabiaSenegalSerbiaSeychellesSierra LeoneSingaporeSint Maarten (Dutch part)Slovak RepublicSloveniaSmall statesSolomon IslandsSomaliaSouth AfricaSouth AsiaSouth Asia (IDA & IBRD)South SudanSpainSri LankaSt. Kitts and NevisSt. LuciaSt. Vincent and the GrenadinesSub-Saharan Africa Sub-Saharan Africa (excluding high income)Sub-Saharan Africa (IDA & IBRD countries)SudanSurinameSwazilandSwedenSwitzerlandSyrian Arab RepublicTajikistanTanzaniaThailandTimor-LesteTogoTongaTrinidad and TobagoTunisiaTurkeyTurkmenistanTurks and Caicos IslandsTuvaluUgandaUkraineUnited Arab EmiratesUnited KingdomUnited StatesUpper middle incomeUruguayUzbekistanVanuatuVenezuela, RBVietnamWest Bank and GazaWorldYemen, Rep.ZambiaZimbabwe línea de tiempo (timeline):
En esta escala de tiempo se presenta un gráfico de 1971 y 2015 de Costa Rica. Los datos de 1970 están ausentes. El número de observaciones reales por fecha: 43.
Fuente (nombre):
Indicadores del desarrollo mundial
Fuente (organización):
UNESCO Institute for Statistics
Categorías:
Education, Gender
Se ha actualizado:
23 abr 2017 año
Los indicadores de los cambios de valor en los últimos años
Mínimo:
49.677
1 ene 2008 año
Máximo:
54.114
1 ene 1978 año
A la fecha de observación
Valor
Cambio absoluto
El cambio con respecto al valor anterior
1 ene 1971 año
52.633
+52.633
0.0%
1 ene 1972 año
52.715
+0.081
0.15%
1 ene 1973 año
53.173
+0.458
0.87%
1 ene 1974 año
53.149
-0.024
-0.04%
1 ene 1975 año
53.098
-0.052
-0.1%
1 ene 1976 año
53.423
+0.325
0.61%
1 ene 1977 año
53.854
+0.431
0.81%
1 ene 1978 año
54.114
+0.261
0.48%
1 ene 1980 año
53.61
-0.505
-0.93%
1 ene 1981 año
53.779
+0.169
0.32%
1 ene 1982 año
53.485
-0.294
-0.55%
1 ene 1983 año
53.18
-0.305
-0.57%
1 ene 1984 año
52.678
-0.502
-0.94%
1 ene 1985 año
52.15
-0.528
-1.0%
1 ene 1986 año
52.165
+0.015
0.03%
1 ene 1987 año
51.502
-0.663
-1.27%
1 ene 1988 año
51.158
-0.344
-0.67%
1 ene 1989 año
50.705
-0.453
-0.89%
1 ene 1990 año
50.499
-0.206
-0.41%
1 ene 1991 año
50.781
+0.282
0.56%
1 ene 1992 año
51.01
+0.229
0.45%
1 ene 1993 año
51.022
+0.012
0.02%
1 ene 1994 año
51.347
+0.325
0.64%
1 ene 1995 año
51.507
+0.16
0.31%
1 ene 1996 año
51.552
+0.045
0.09%
1 ene 1997 año
51.757
+0.205
0.4%
1 ene 1998 año
51.841
+0.083
0.16%
1 ene 1999 año
51.056
-0.785
-1.51%
1 ene 2000 año
51.241
+0.186
0.36%
1 ene 2001 año
50.983
-0.259
-0.5%
1 ene 2002 año
50.852
-0.13
-0.26%
1 ene 2003 año
50.612
-0.241
-0.47%
1 ene 2005 año
49.954
-0.657
-1.3%
1 ene 2006 año
49.846
-0.108
-0.22%
1 ene 2007 año
50.037
+0.192
0.38%
1 ene 2008 año
49.677
-0.36
-0.72%
1 ene 2009 año
49.853
+0.176
0.35%
1 ene 2010 año
49.933
+0.08
0.16%
1 ene 2011 año
49.888
-0.045
-0.09%
1 ene 2012 año
49.819
-0.069
-0.14%
1 ene 2013 año
49.745
-0.074
-0.15%
1 ene 2014 año
50.041
+0.296
0.6%
1 ene 2015 año
49.814
-0.227
-0.45%
Ranking de los países por los datos estadísticos actuales


Comentarios: