29
/es/
es
AIzaSyAYiBZKx7MnpbEhh9jyipgxe19OcubqV5w
April 1, 2024
83763
Benin
BEN
true
2
1
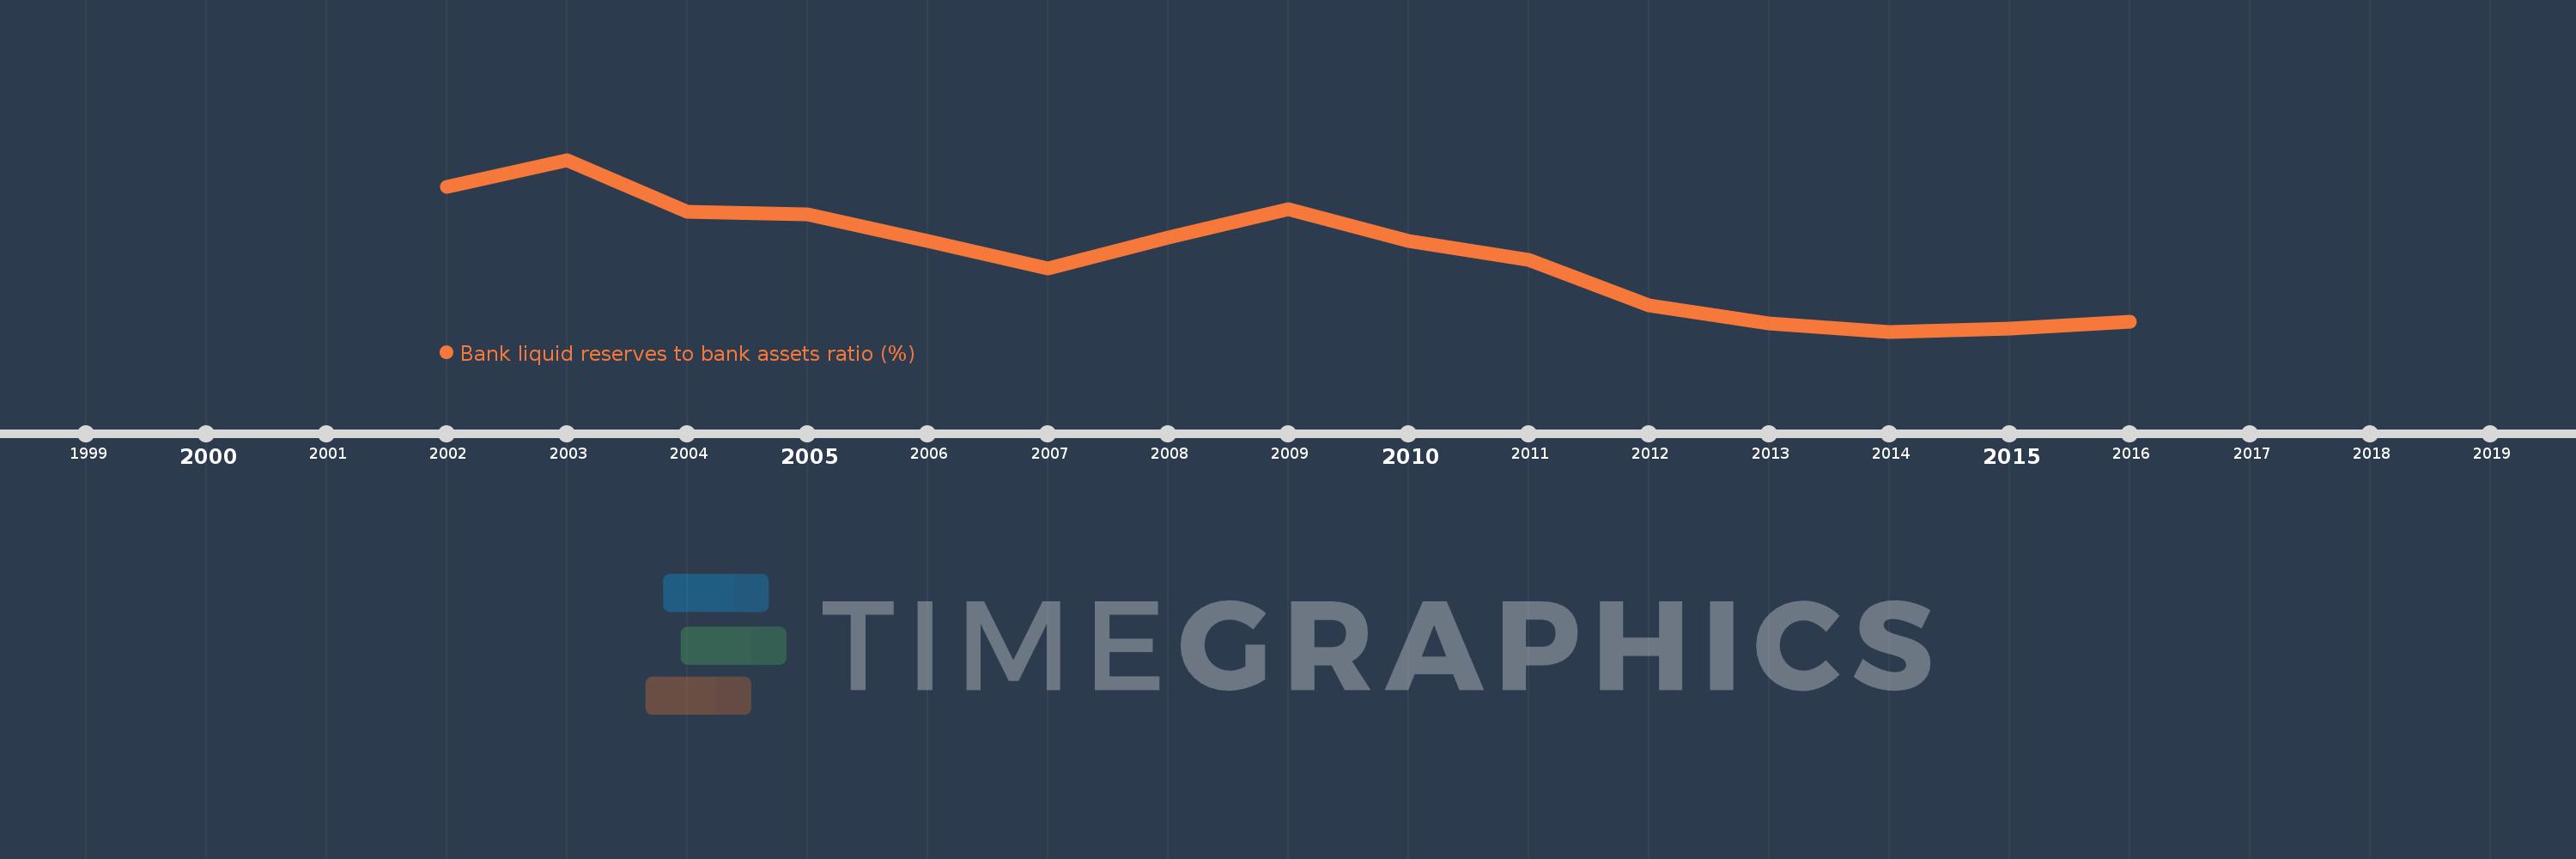
Bank liquid reserves to bank assets ratio (%)
2016,2015,2014,2013,2012,2011,2010,2009,2008,2007,2006,2005,2004,2003,2002
Estas estadísticas en otros países:
línea de tiempo (timeline):
En esta escala de tiempo se presenta un gráfico de 2002 y 2016 de Benin. Los datos de 2001 están ausentes. El número de observaciones reales por fecha: 15.
Fuente (nombre):
Indicadores del desarrollo mundial
Fuente (organización):
International Monetary Fund, International Financial Statistics and data files.
Categorías:
Financial Sector
Se ha actualizado:
23 abr 2017 año
Los indicadores de los cambios de valor en los últimos años
Mínimo:
5.352
1 ene 2014 año
Máximo:
23.368
1 ene 2003 año
A la fecha de observación
Valor
Cambio absoluto
El cambio con respecto al valor anterior
1 ene 2002 año
20.538
+20.538
0.0%
1 ene 2003 año
23.368
+2.831
13.78%
1 ene 2004 año
17.901
-5.467
-23.4%
1 ene 2005 año
17.662
-0.239
-1.33%
1 ene 2006 año
14.859
-2.804
-15.87%
1 ene 2007 año
11.941
-2.918
-19.64%
1 ene 2008 año
15.214
+3.273
27.41%
1 ene 2009 año
18.169
+2.955
19.42%
1 ene 2010 año
14.861
-3.307
-18.2%
1 ene 2011 año
12.906
-1.955
-13.15%
1 ene 2012 año
8.104
-4.802
-37.21%
1 ene 2013 año
6.199
-1.905
-23.51%
1 ene 2014 año
5.352
-0.847
-13.66%
1 ene 2015 año
5.678
+0.326
6.09%
1 ene 2016 año
6.394
+0.716
12.6%
Ranking de los países por los datos estadísticos actuales


Comentarios: