29
/es/
es
AIzaSyAYiBZKx7MnpbEhh9jyipgxe19OcubqV5w
April 1, 2024
124491
Egypt, Arab Rep.
EGY
true
2
1
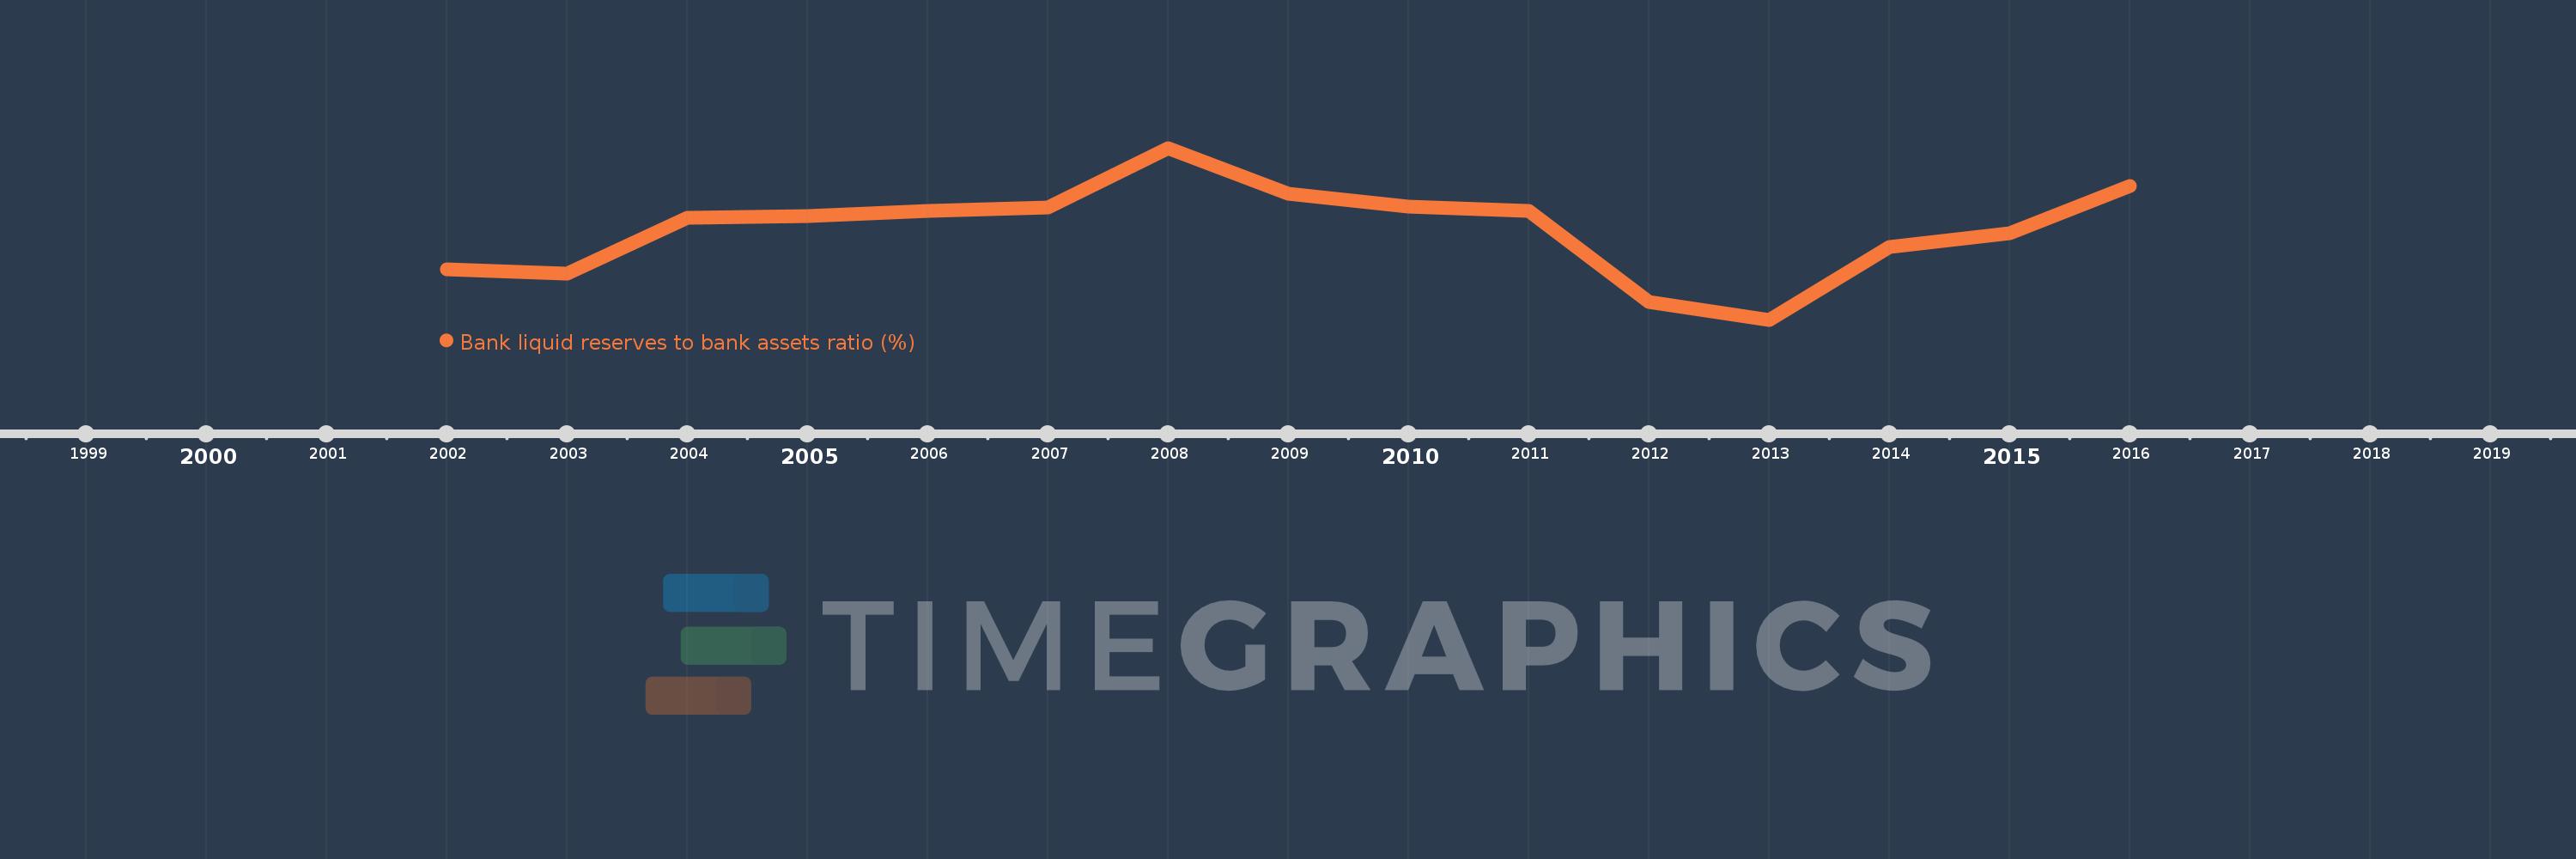
Bank liquid reserves to bank assets ratio (%)
2016,2015,2014,2013,2012,2011,2010,2009,2008,2007,2006,2005,2004,2003,2002
Estas estadísticas en otros países:
línea de tiempo (timeline):
En esta escala de tiempo se presenta un gráfico de 2002 y 2016 de Egypt, Arab Rep.. Los datos de 2001 están ausentes. El número de observaciones reales por fecha: 15.
Fuente (nombre):
Indicadores del desarrollo mundial
Fuente (organización):
International Monetary Fund, International Financial Statistics and data files.
Categorías:
Financial Sector
Se ha actualizado:
23 abr 2017 año
Los indicadores de los cambios de valor en los últimos años
Mínimo:
13.45
1 ene 2013 año
Máximo:
44.852
1 ene 2008 año
A la fecha de observación
Valor
Cambio absoluto
El cambio con respecto al valor anterior
1 ene 2002 año
22.608
+22.608
0.0%
1 ene 2003 año
21.868
-0.739
-3.27%
1 ene 2004 año
32.137
+10.269
46.96%
1 ene 2005 año
32.446
+0.309
0.96%
1 ene 2006 año
33.379
+0.932
2.87%
1 ene 2007 año
34.046
+0.667
2.0%
1 ene 2008 año
44.852
+10.806
31.74%
1 ene 2009 año
36.51
-8.342
-18.6%
1 ene 2010 año
34.161
-2.35
-6.44%
1 ene 2011 año
33.308
-0.852
-2.49%
1 ene 2012 año
16.762
-16.546
-49.68%
1 ene 2013 año
13.45
-3.312
-19.76%
1 ene 2014 año
26.792
+13.342
99.2%
1 ene 2015 año
29.288
+2.496
9.31%
1 ene 2016 año
37.939
+8.65
29.54%
Ranking de los países por los datos estadísticos actuales


Comentarios: