29
/es/
es
AIzaSyAYiBZKx7MnpbEhh9jyipgxe19OcubqV5w
April 1, 2024
167146
Kenya
KEN
true
2
1
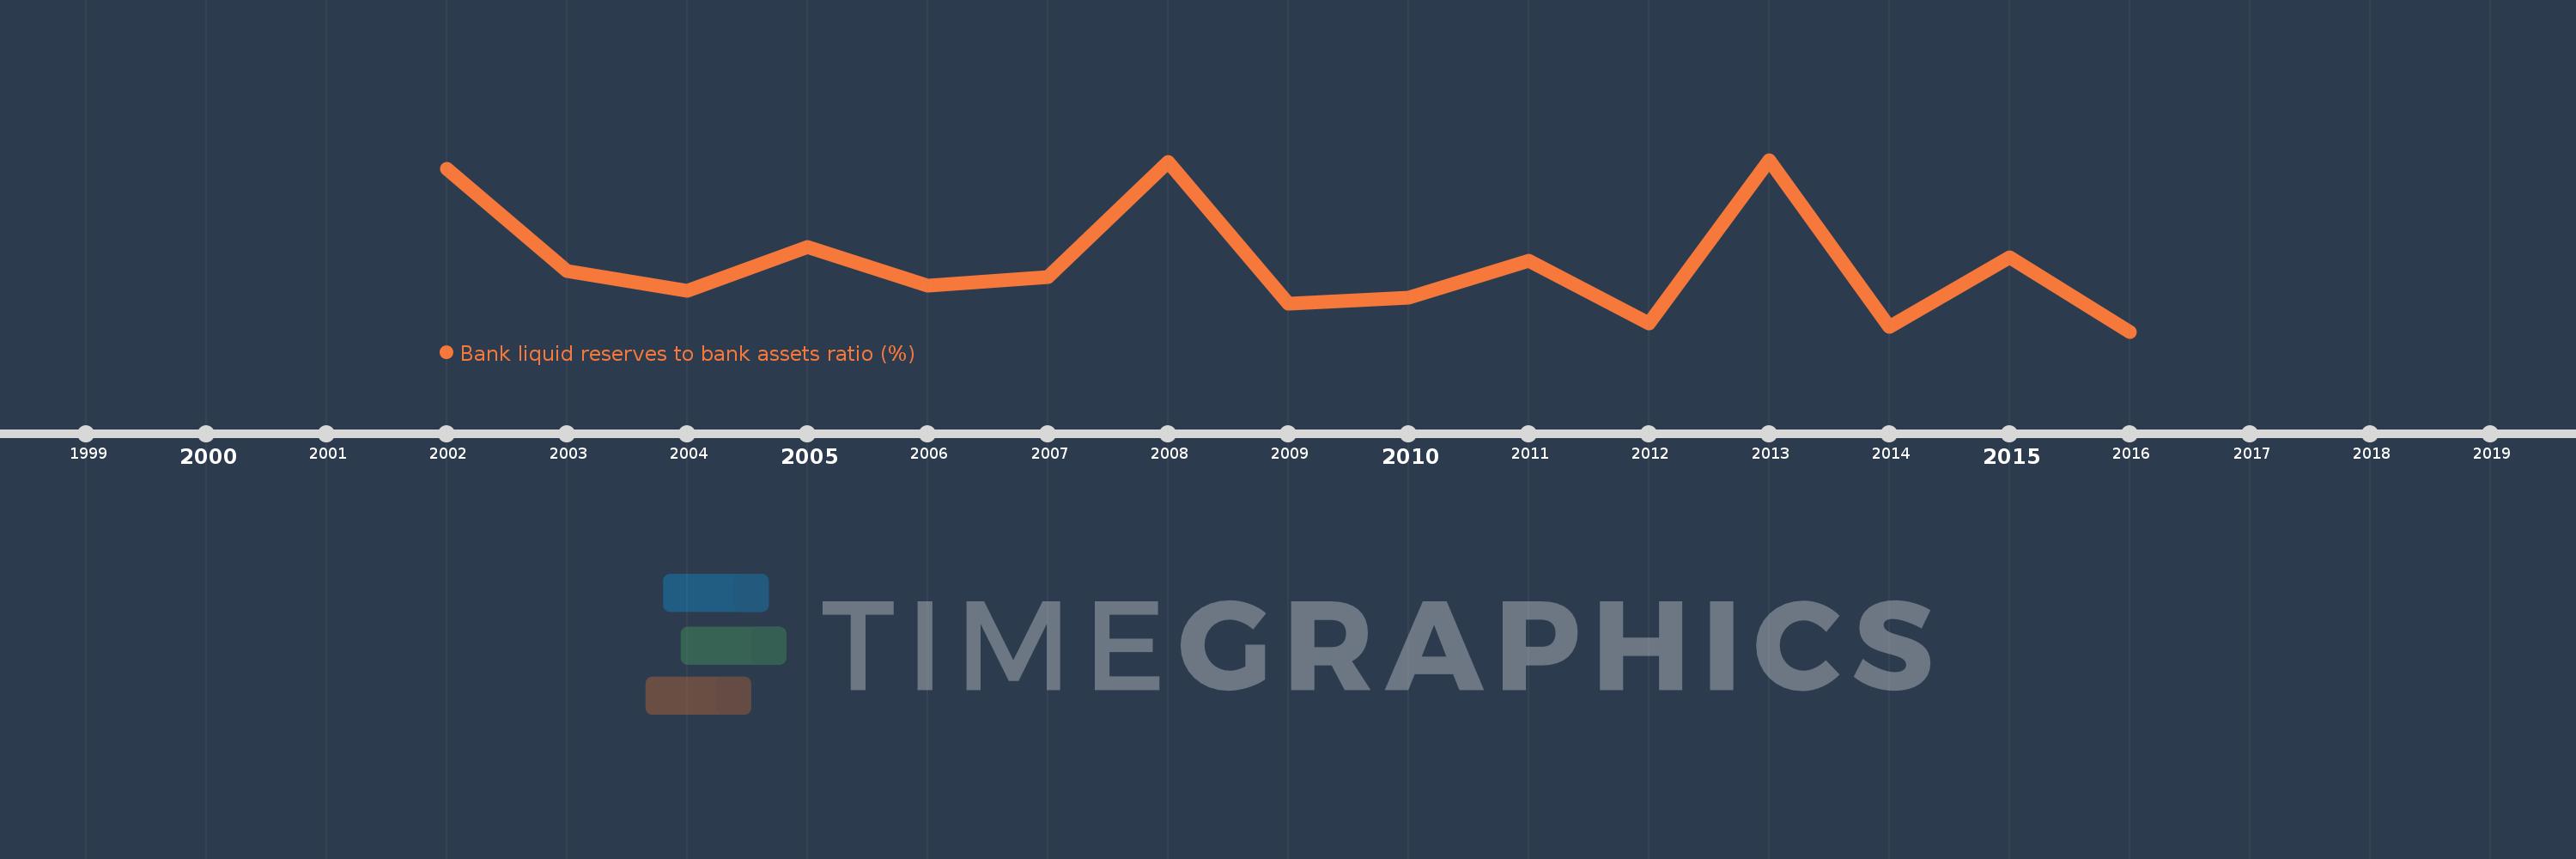
Bank liquid reserves to bank assets ratio (%)
2016,2015,2014,2013,2012,2011,2010,2009,2008,2007,2006,2005,2004,2003,2002
Estas estadísticas en otros países:
línea de tiempo (timeline):
En esta escala de tiempo se presenta un gráfico de 2002 y 2016 de Kenya. Los datos de 2001 están ausentes. El número de observaciones reales por fecha: 15.
Fuente (nombre):
Indicadores del desarrollo mundial
Fuente (organización):
International Monetary Fund, International Financial Statistics and data files.
Categorías:
Financial Sector
Se ha actualizado:
23 abr 2017 año
Los indicadores de los cambios de valor en los últimos años
Mínimo:
9.079
1 ene 2016 año
Máximo:
12.199
1 ene 2013 año
A la fecha de observación
Valor
Cambio absoluto
El cambio con respecto al valor anterior
1 ene 2002 año
12.029
+12.029
0.0%
1 ene 2003 año
10.179
-1.85
-15.38%
1 ene 2004 año
9.814
-0.365
-3.58%
1 ene 2005 año
10.619
+0.805
8.2%
1 ene 2006 año
9.915
-0.704
-6.63%
1 ene 2007 año
10.067
+0.152
1.53%
1 ene 2008 año
12.162
+2.095
20.81%
1 ene 2009 año
9.589
-2.573
-21.16%
1 ene 2010 año
9.697
+0.108
1.13%
1 ene 2011 año
10.371
+0.674
6.95%
1 ene 2012 año
9.231
-1.14
-10.99%
1 ene 2013 año
12.199
+2.967
32.15%
1 ene 2014 año
9.161
-3.038
-24.9%
1 ene 2015 año
10.423
+1.262
13.78%
1 ene 2016 año
9.079
-1.345
-12.9%
Ranking de los países por los datos estadísticos actuales


Comentarios: