29
/es/
es
AIzaSyAYiBZKx7MnpbEhh9jyipgxe19OcubqV5w
April 1, 2024
103313
Chad
TCD
true
2
1
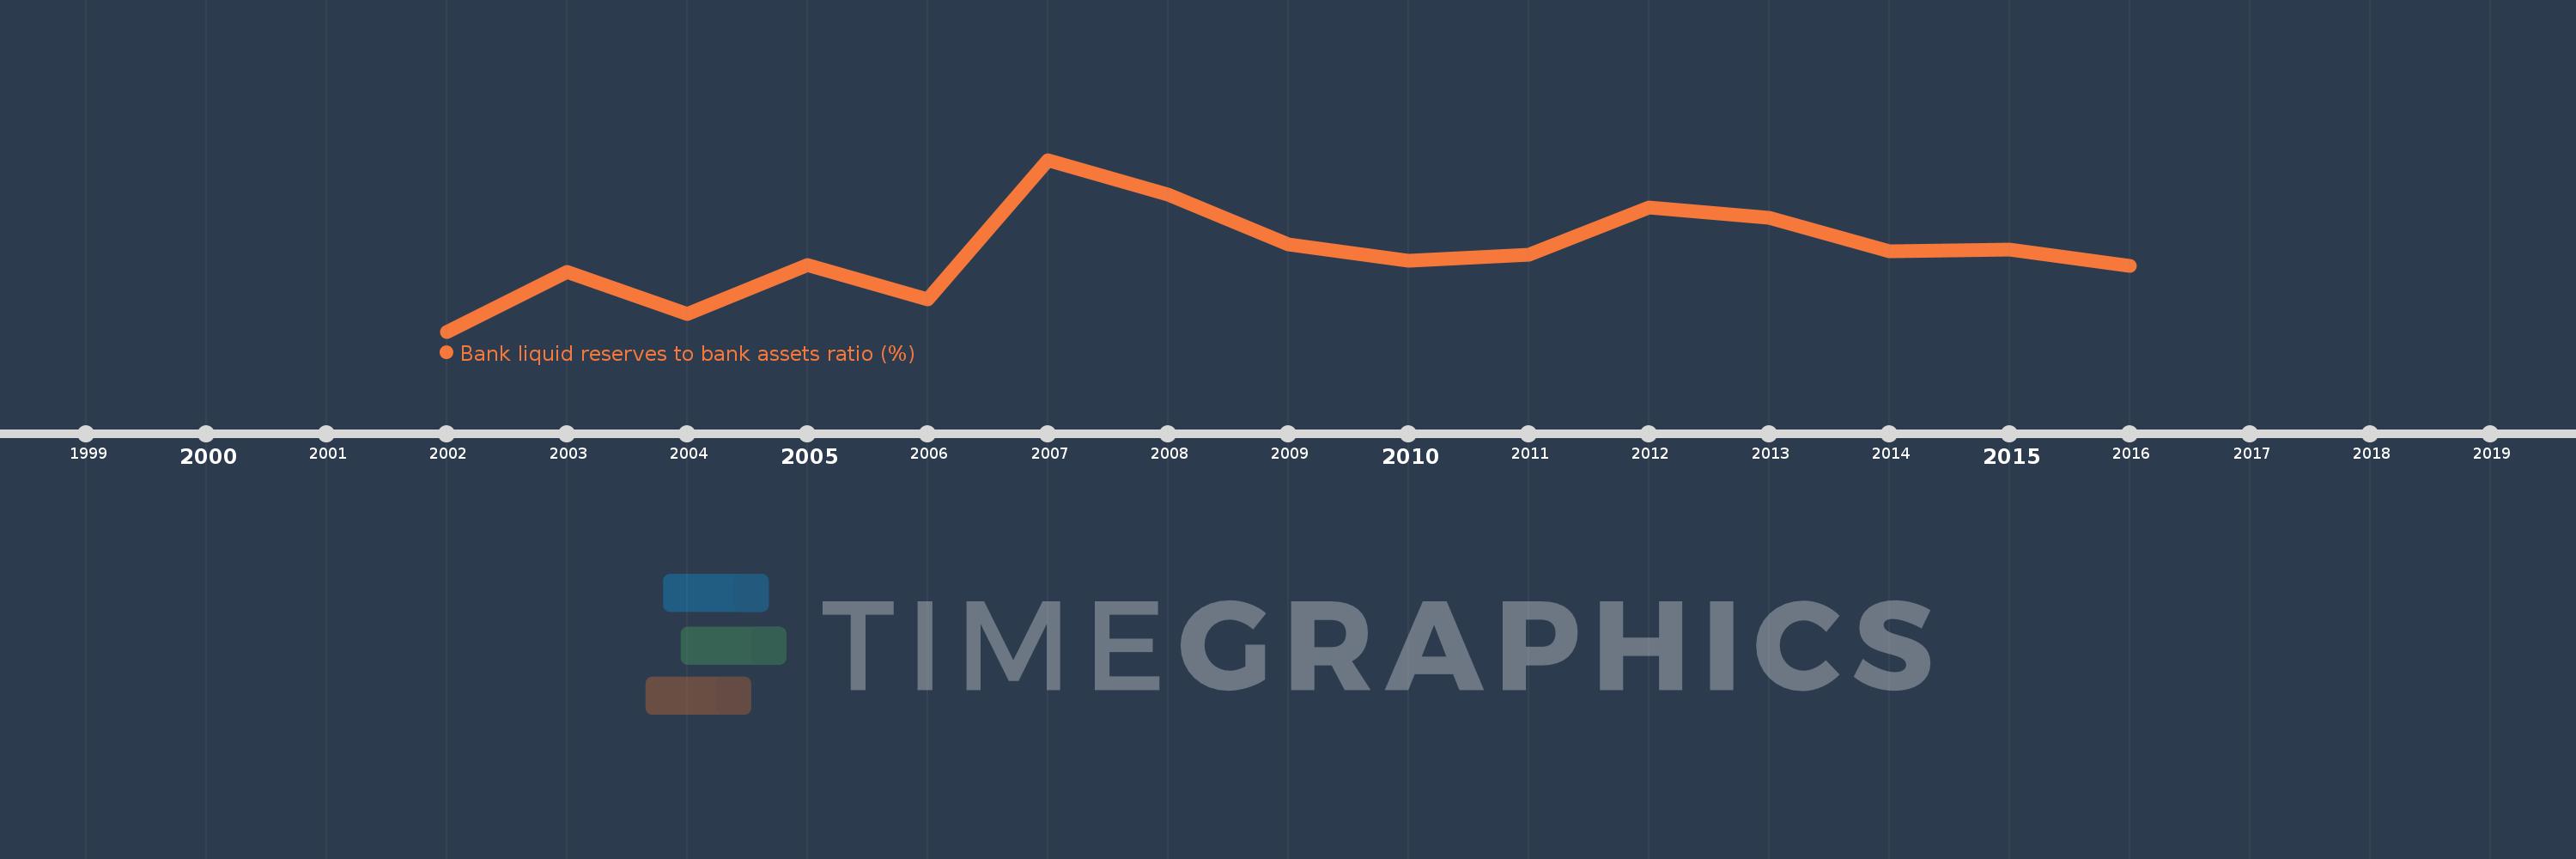
Bank liquid reserves to bank assets ratio (%)
2016,2015,2014,2013,2012,2011,2010,2009,2008,2007,2006,2005,2004,2003,2002
Estas estadísticas en otros países:
línea de tiempo (timeline):
En esta escala de tiempo se presenta un gráfico de 2002 y 2016 de Chad. Los datos de 2001 están ausentes. El número de observaciones reales por fecha: 15.
Fuente (nombre):
Indicadores del desarrollo mundial
Fuente (organización):
International Monetary Fund, International Financial Statistics and data files.
Categorías:
Financial Sector
Se ha actualizado:
23 abr 2017 año
Los indicadores de los cambios de valor en los últimos años
Mínimo:
13.652
1 ene 2002 año
Máximo:
43.672
1 ene 2007 año
A la fecha de observación
Valor
Cambio absoluto
El cambio con respecto al valor anterior
1 ene 2002 año
13.652
+13.652
0.0%
1 ene 2003 año
24.055
+10.403
76.2%
1 ene 2004 año
16.681
-7.375
-30.66%
1 ene 2005 año
25.335
+8.655
51.88%
1 ene 2006 año
19.327
-6.009
-23.72%
1 ene 2007 año
43.672
+24.346
125.97%
1 ene 2008 año
37.583
-6.089
-13.94%
1 ene 2009 año
28.837
-8.746
-23.27%
1 ene 2010 año
25.969
-2.868
-9.95%
1 ene 2011 año
27.083
+1.114
4.29%
1 ene 2012 año
35.308
+8.225
30.37%
1 ene 2013 año
33.564
-1.743
-4.94%
1 ene 2014 año
27.698
-5.867
-17.48%
1 ene 2015 año
27.934
+0.236
0.85%
1 ene 2016 año
25.15
-2.783
-9.96%
Ranking de los países por los datos estadísticos actuales


Comentarios: