29
/it/
it
AIzaSyAYiBZKx7MnpbEhh9jyipgxe19OcubqV5w
April 1, 2024
103313
Chad
TCD
true
2
1
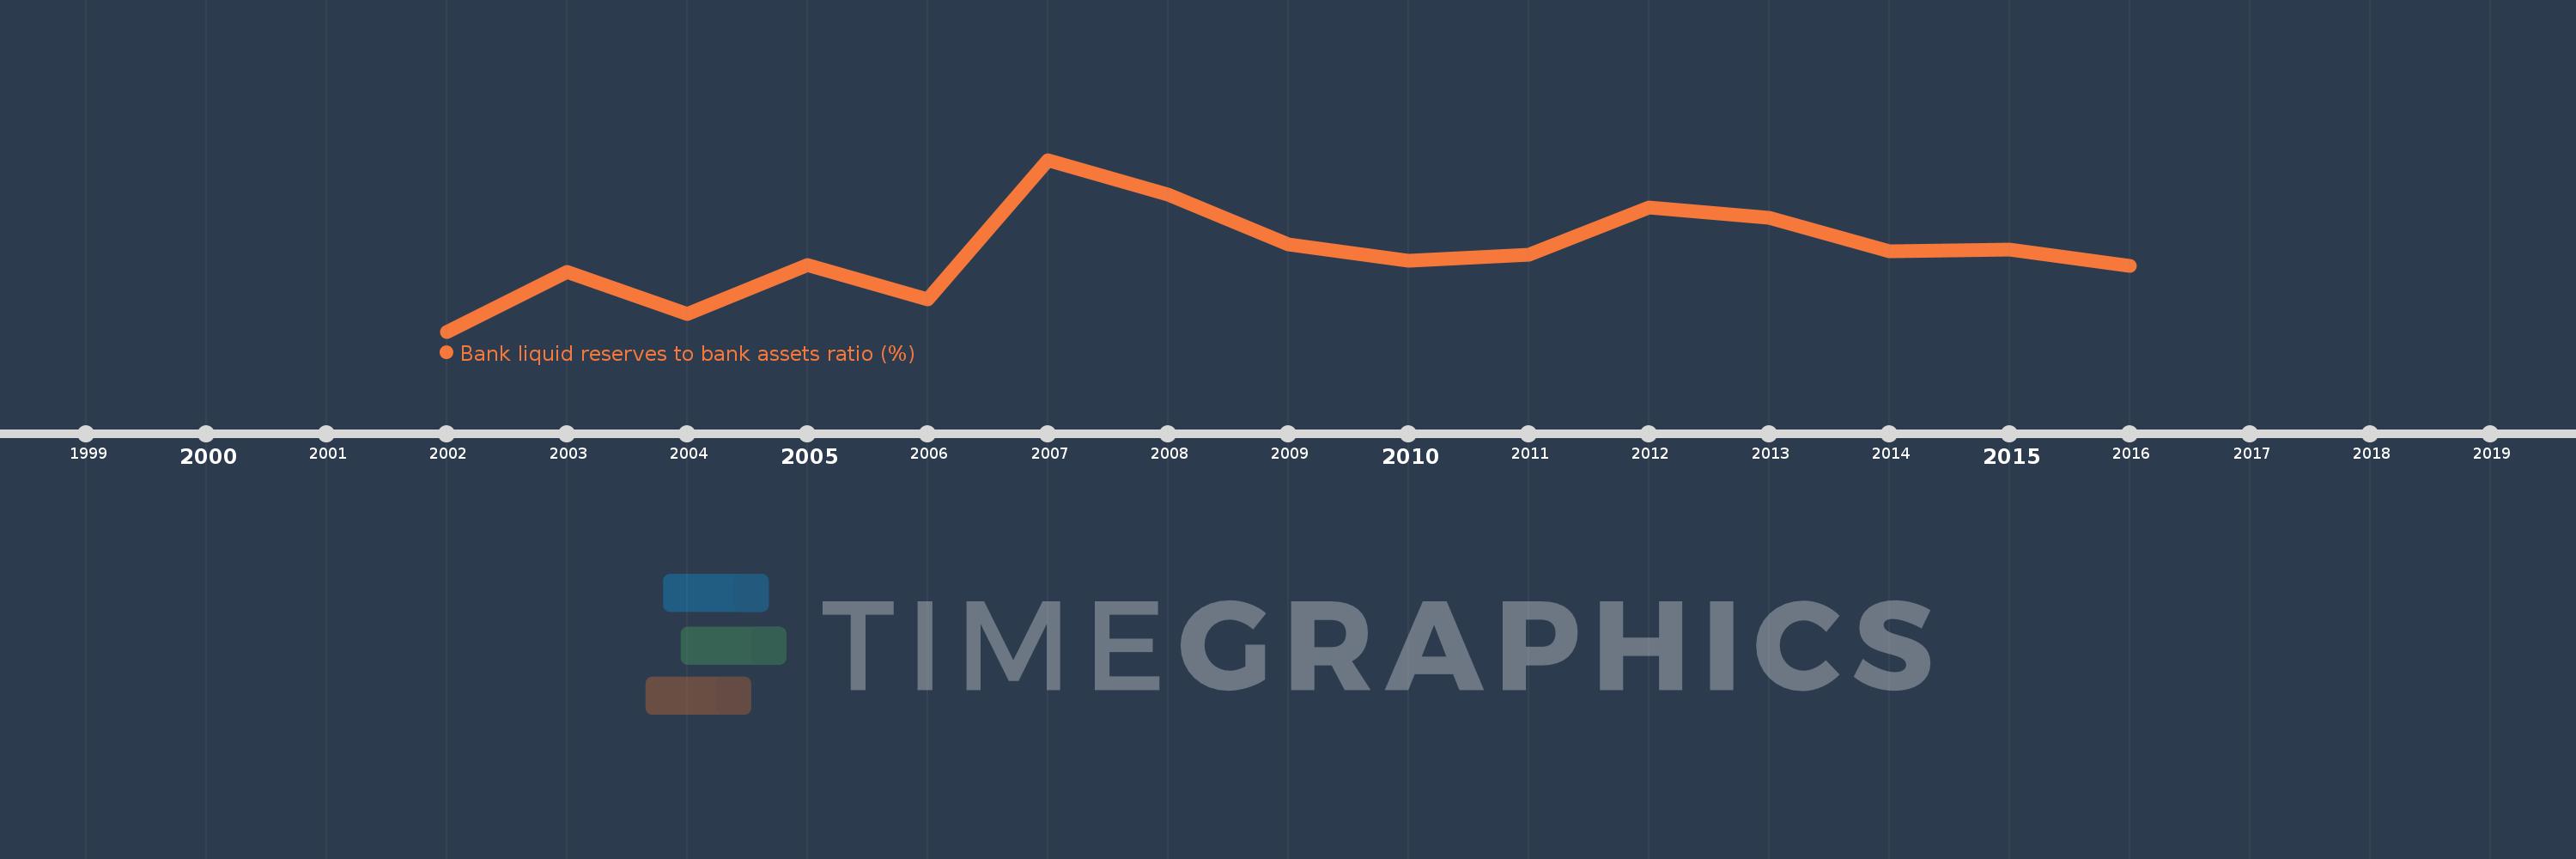
Bank liquid reserves to bank assets ratio (%)
2016,2015,2014,2013,2012,2011,2010,2009,2008,2007,2006,2005,2004,2003,2002
Queste statistiche in altri paesi:
Linea del tempo:
Questa scala temporale mostra un grafico dal 2002 anno al 2016 anno. Chad. I dati fino ad 2001 anno non disponibili. Il numero di osservazioni attuali secondo i date: 15.
La fonte (nome):
Indicatori dello sviluppo mondiale
La fonte (organizzazione):
International Monetary Fund, International Financial Statistics and data files.
Categorie:
Financial Sector
sono stati aggiornati
23 apr 2017 anni
Indicatori delle variazioni dei valori per anni
Minima:
13.652
1 gen 2002 anni
Massimo:
43.672
1 gen 2007 anni
Alla data di osservazione
Valore
Variazione assoluta
La variazione rispetto al valore precedente
1 gen 2002 anni
13.652
+13.652
0.0%
1 gen 2003 anni
24.055
+10.403
76.2%
1 gen 2004 anni
16.681
-7.375
-30.66%
1 gen 2005 anni
25.335
+8.655
51.88%
1 gen 2006 anni
19.327
-6.009
-23.72%
1 gen 2007 anni
43.672
+24.346
125.97%
1 gen 2008 anni
37.583
-6.089
-13.94%
1 gen 2009 anni
28.837
-8.746
-23.27%
1 gen 2010 anni
25.969
-2.868
-9.95%
1 gen 2011 anni
27.083
+1.114
4.29%
1 gen 2012 anni
35.308
+8.225
30.37%
1 gen 2013 anni
33.564
-1.743
-4.94%
1 gen 2014 anni
27.698
-5.867
-17.48%
1 gen 2015 anni
27.934
+0.236
0.85%
1 gen 2016 anni
25.15
-2.783
-9.96%
Classificazione dei paesi secondo i statistiche attuali per anni


Commenti: