29
/it/
it
AIzaSyAYiBZKx7MnpbEhh9jyipgxe19OcubqV5w
April 1, 2024
227183
Qatar
QAT
true
2
1
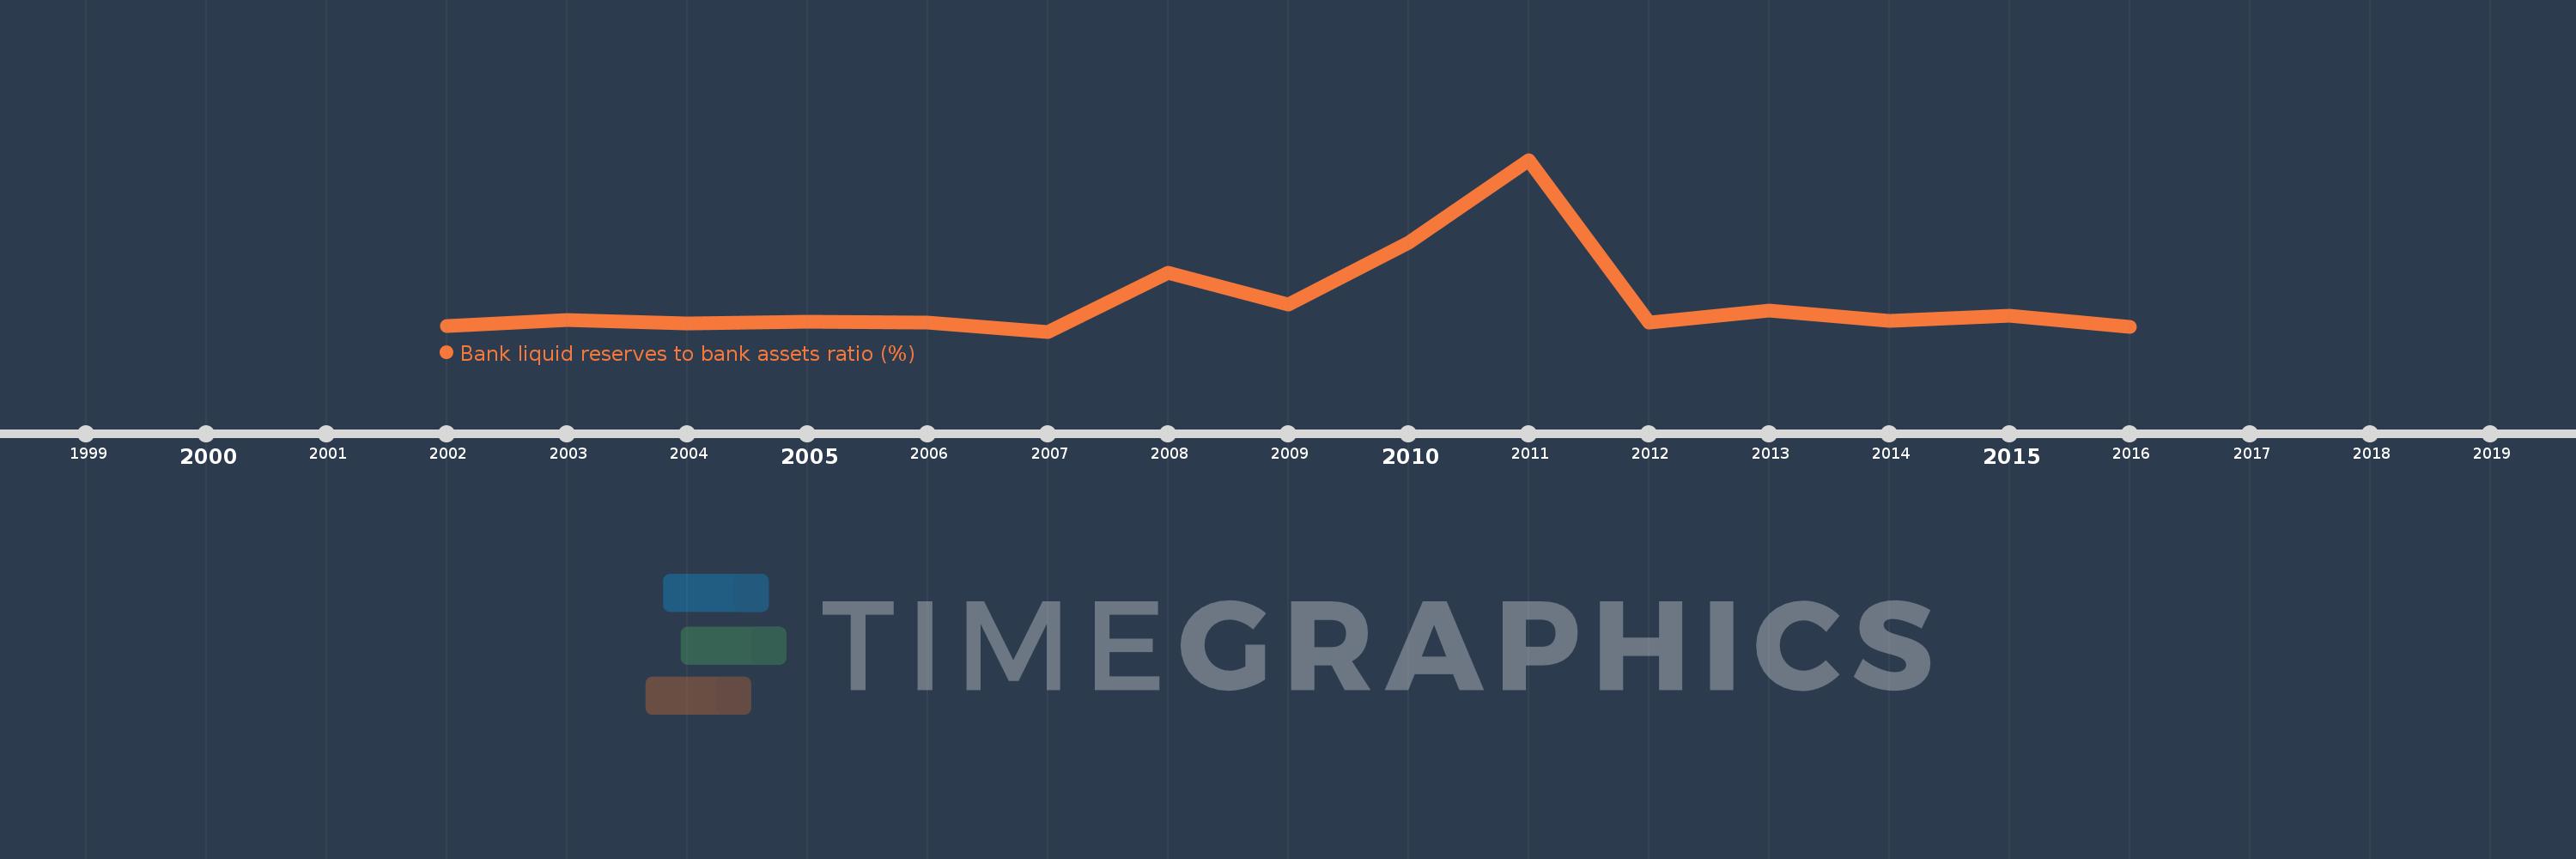
Bank liquid reserves to bank assets ratio (%)
2016,2015,2014,2013,2012,2011,2010,2009,2008,2007,2006,2005,2004,2003,2002
Queste statistiche in altri paesi:
Linea del tempo:
Questa scala temporale mostra un grafico dal 2002 anno al 2016 anno. Qatar. I dati fino ad 2001 anno non disponibili. Il numero di osservazioni attuali secondo i date: 15.
La fonte (nome):
Indicatori dello sviluppo mondiale
La fonte (organizzazione):
International Monetary Fund, International Financial Statistics and data files.
Categorie:
Financial Sector
sono stati aggiornati
23 apr 2017 anni
Indicatori delle variazioni dei valori per anni
Minima:
4.012
1 gen 2007 anni
Massimo:
24.992
1 gen 2011 anni
Alla data di osservazione
Valore
Variazione assoluta
La variazione rispetto al valore precedente
1 gen 2002 anni
4.702
+4.702
0.0%
1 gen 2003 anni
5.464
+0.762
16.2%
1 gen 2004 anni
5.033
-0.431
-7.89%
1 gen 2005 anni
5.214
+0.181
3.59%
1 gen 2006 anni
5.079
-0.135
-2.58%
1 gen 2007 anni
4.012
-1.067
-21.01%
1 gen 2008 anni
11.146
+7.133
177.79%
1 gen 2009 anni
7.331
-3.814
-34.22%
1 gen 2010 anni
14.868
+7.537
102.81%
1 gen 2011 anni
24.992
+10.124
68.09%
1 gen 2012 anni
5.14
-19.852
-79.43%
1 gen 2013 anni
6.534
+1.394
27.11%
1 gen 2014 anni
5.28
-1.254
-19.19%
1 gen 2015 anni
5.959
+0.679
12.85%
1 gen 2016 anni
4.564
-1.395
-23.41%
Classificazione dei paesi secondo i statistiche attuali per anni


Commenti: