29
/it/
it
AIzaSyAYiBZKx7MnpbEhh9jyipgxe19OcubqV5w
April 1, 2024
42132
Latin America & Caribbean (excluding high income)
LAC
false
2
1
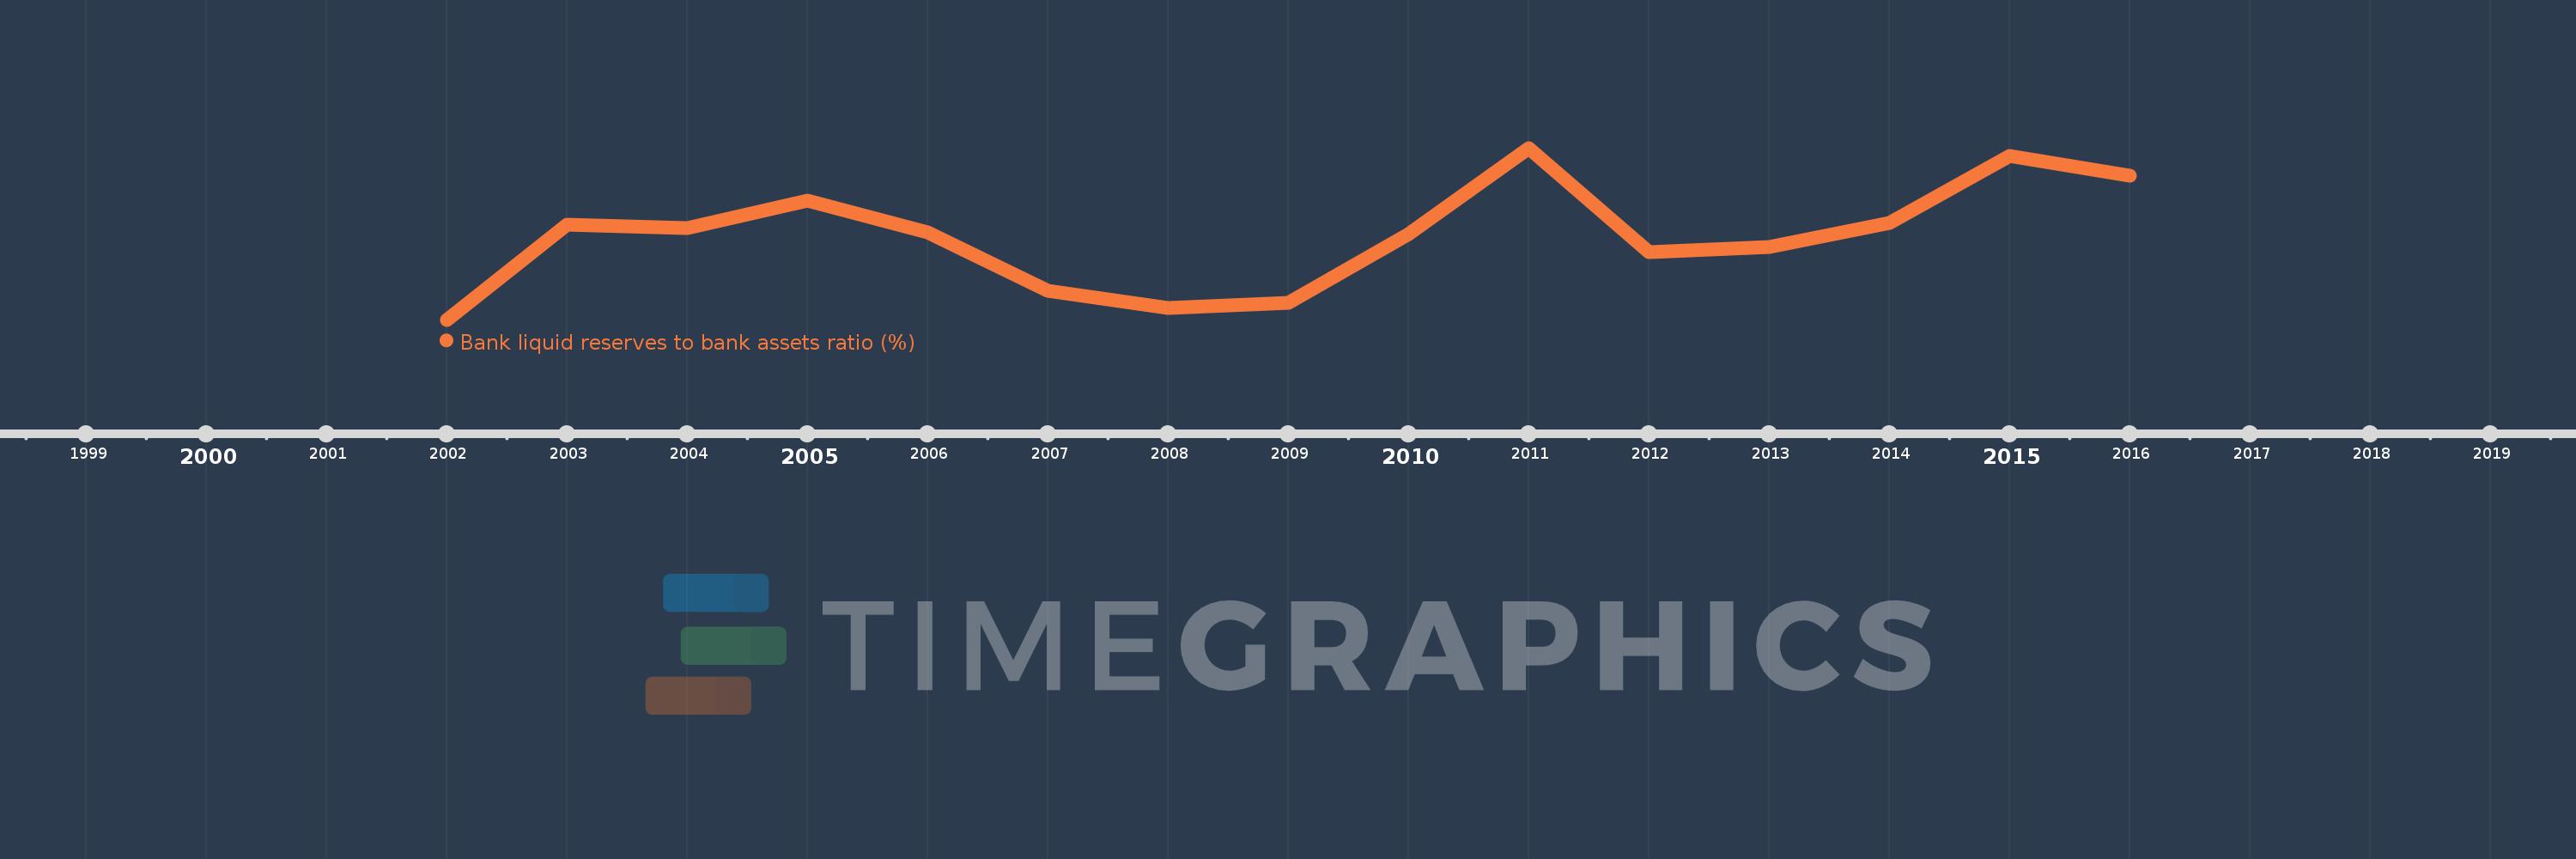
Bank liquid reserves to bank assets ratio (%)
2016,2015,2014,2013,2012,2011,2010,2009,2008,2007,2006,2005,2004,2003,2002
Queste statistiche in altri paesi:
Linea del tempo:
Questa scala temporale mostra un grafico dal 2002 anno al 2016 anno. Latin America & Caribbean (excluding high income). I dati fino ad 2001 anno non disponibili. Il numero di osservazioni attuali secondo i date: 15.
La fonte (nome):
Indicatori dello sviluppo mondiale
La fonte (organizzazione):
International Monetary Fund, International Financial Statistics and data files.
Categorie:
Financial Sector
sono stati aggiornati
23 apr 2017 anni
Indicatori delle variazioni dei valori per anni
Minima:
17.371
1 gen 2002 anni
Massimo:
23.933
1 gen 2011 anni
Alla data di osservazione
Valore
Variazione assoluta
La variazione rispetto al valore precedente
1 gen 2002 anni
17.371
+17.371
0.0%
1 gen 2003 anni
20.997
+3.625
20.87%
1 gen 2004 anni
20.862
-0.135
-0.64%
1 gen 2005 anni
21.907
+1.046
5.01%
1 gen 2006 anni
20.694
-1.213
-5.54%
1 gen 2007 anni
18.466
-2.229
-10.77%
1 gen 2008 anni
17.807
-0.659
-3.57%
1 gen 2009 anni
18.012
+0.206
1.15%
1 gen 2010 anni
20.64
+2.628
14.59%
1 gen 2011 anni
23.933
+3.292
15.95%
1 gen 2012 anni
19.94
-3.993
-16.68%
1 gen 2013 anni
20.139
+0.199
1.0%
1 gen 2014 anni
21.065
+0.926
4.6%
1 gen 2015 anni
23.634
+2.569
12.2%
1 gen 2016 anni
22.858
-0.776
-3.28%
Classificazione dei paesi secondo i statistiche attuali per anni


Commenti: