29
/es/
es
AIzaSyAYiBZKx7MnpbEhh9jyipgxe19OcubqV5w
April 1, 2024
113275
Cote d'Ivoire
CIV
true
2
1
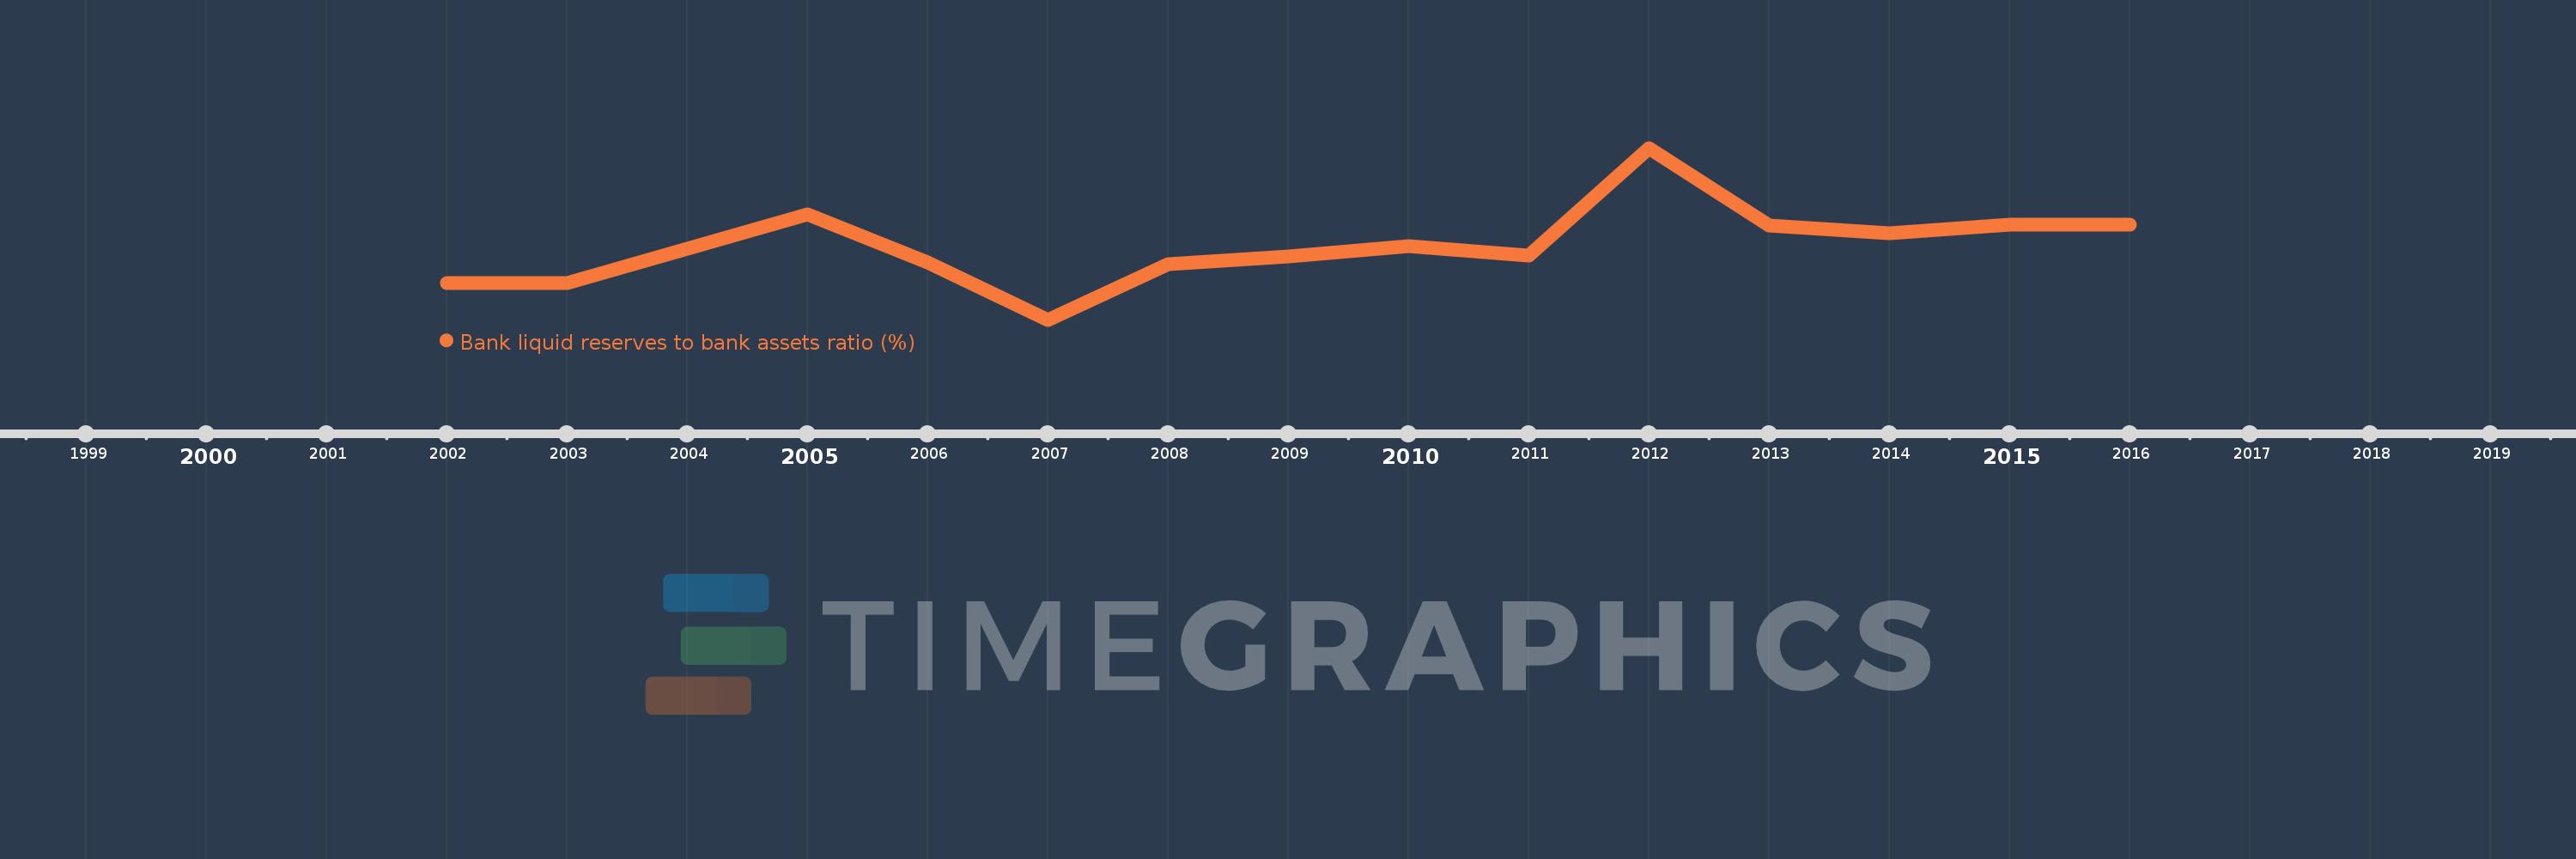
Bank liquid reserves to bank assets ratio (%)
2016,2015,2014,2013,2012,2011,2010,2009,2008,2007,2006,2005,2004,2003,2002
Estas estadísticas en otros países:
línea de tiempo (timeline):
En esta escala de tiempo se presenta un gráfico de 2002 y 2016 de Cote d'Ivoire. Los datos de 2001 están ausentes. El número de observaciones reales por fecha: 15.
Fuente (nombre):
Indicadores del desarrollo mundial
Fuente (organización):
International Monetary Fund, International Financial Statistics and data files.
Categorías:
Financial Sector
Se ha actualizado:
23 abr 2017 año
Los indicadores de los cambios de valor en los últimos años
Mínimo:
2.761
1 ene 2007 año
Máximo:
25.716
1 ene 2012 año
A la fecha de observación
Valor
Cambio absoluto
El cambio con respecto al valor anterior
1 ene 2002 año
7.62
+7.62
0.0%
1 ene 2003 año
7.701
+0.08
1.05%
1 ene 2004 año
12.237
+4.537
58.92%
1 ene 2005 año
16.847
+4.609
37.67%
1 ene 2006 año
10.458
-6.388
-37.92%
1 ene 2007 año
2.761
-7.697
-73.6%
1 ene 2008 año
10.191
+7.43
269.1%
1 ene 2009 año
11.177
+0.986
9.67%
1 ene 2010 año
12.624
+1.447
12.95%
1 ene 2011 año
11.362
-1.262
-10.0%
1 ene 2012 año
25.716
+14.355
126.34%
1 ene 2013 año
15.369
-10.347
-40.24%
1 ene 2014 año
14.29
-1.079
-7.02%
1 ene 2015 año
15.518
+1.228
8.59%
1 ene 2016 año
15.498
-0.02
-0.13%
Ranking de los países por los datos estadísticos actuales


Comentarios: