29
/es/
es
AIzaSyAYiBZKx7MnpbEhh9jyipgxe19OcubqV5w
April 1, 2024
95826
Burundi
BDI
true
2
1
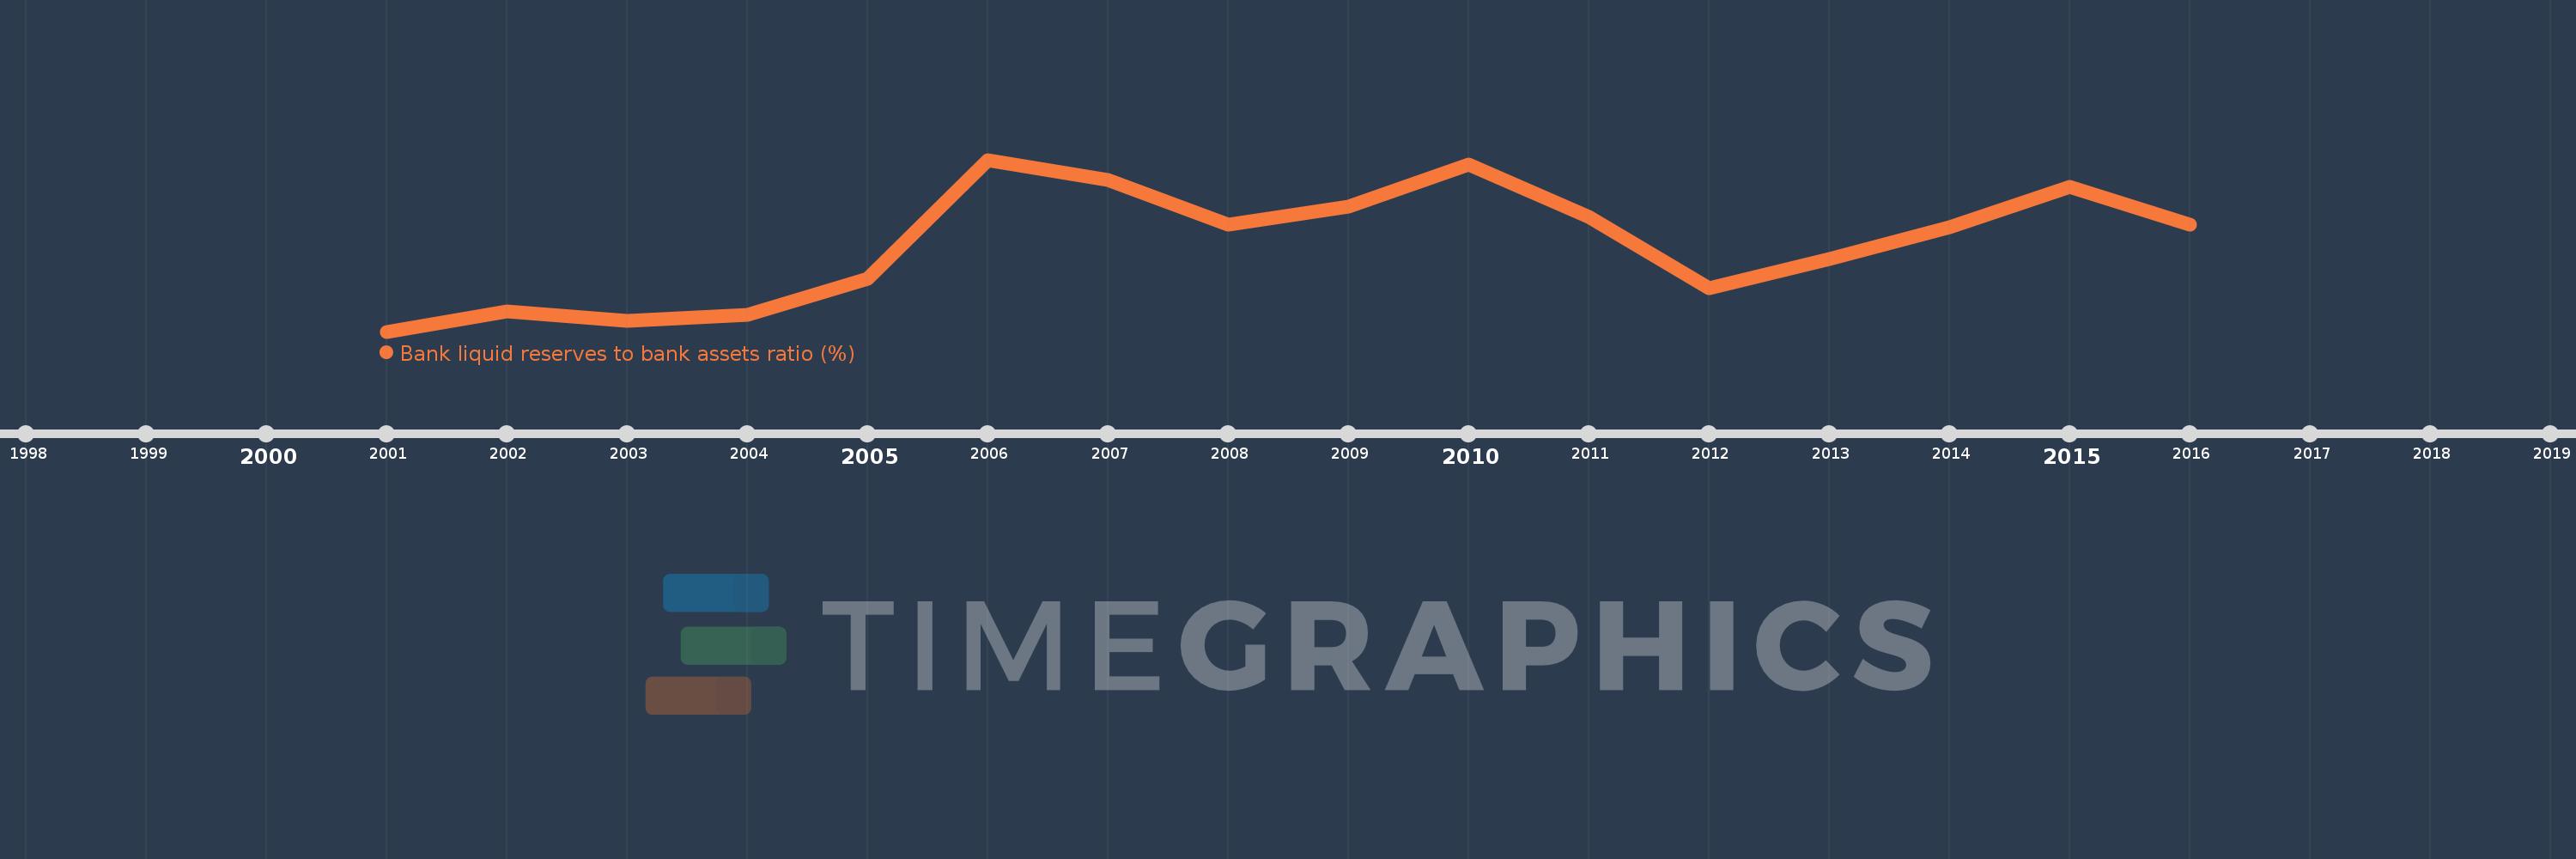
Bank liquid reserves to bank assets ratio (%)
2016,2015,2014,2013,2012,2011,2010,2009,2008,2007,2006,2005,2004,2003,2002,2001
Estas estadísticas en otros países:
línea de tiempo (timeline):
En esta escala de tiempo se presenta un gráfico de 2001 y 2016 de Burundi. Los datos de 2000 están ausentes. El número de observaciones reales por fecha: 16.
Fuente (nombre):
Indicadores del desarrollo mundial
Fuente (organización):
International Monetary Fund, International Financial Statistics and data files.
Categorías:
Financial Sector
Se ha actualizado:
23 abr 2017 año
Los indicadores de los cambios de valor en los últimos años
Mínimo:
2.763
1 ene 2001 año
Máximo:
18.038
1 ene 2006 año
A la fecha de observación
Valor
Cambio absoluto
El cambio con respecto al valor anterior
1 ene 2001 año
2.763
+2.763
0.0%
1 ene 2002 año
4.555
+1.792
64.84%
1 ene 2003 año
3.717
-0.838
-18.41%
1 ene 2004 año
4.236
+0.519
13.97%
1 ene 2005 año
7.43
+3.194
75.39%
1 ene 2006 año
18.038
+10.609
142.79%
1 ene 2007 año
16.271
-1.767
-9.8%
1 ene 2008 año
12.264
-4.007
-24.63%
1 ene 2009 año
13.882
+1.618
13.19%
1 ene 2010 año
17.58
+3.698
26.64%
1 ene 2011 año
12.975
-4.605
-26.19%
1 ene 2012 año
6.592
-6.383
-49.2%
1 ene 2013 año
9.212
+2.62
39.74%
1 ene 2014 año
12.06
+2.848
30.92%
1 ene 2015 año
15.641
+3.581
29.69%
1 ene 2016 año
12.264
-3.377
-21.59%
Ranking de los países por los datos estadísticos actuales


Comentarios: