29
/es/
es
AIzaSyAYiBZKx7MnpbEhh9jyipgxe19OcubqV5w
April 1, 2024
70092
Argentina
ARG
true
2
1
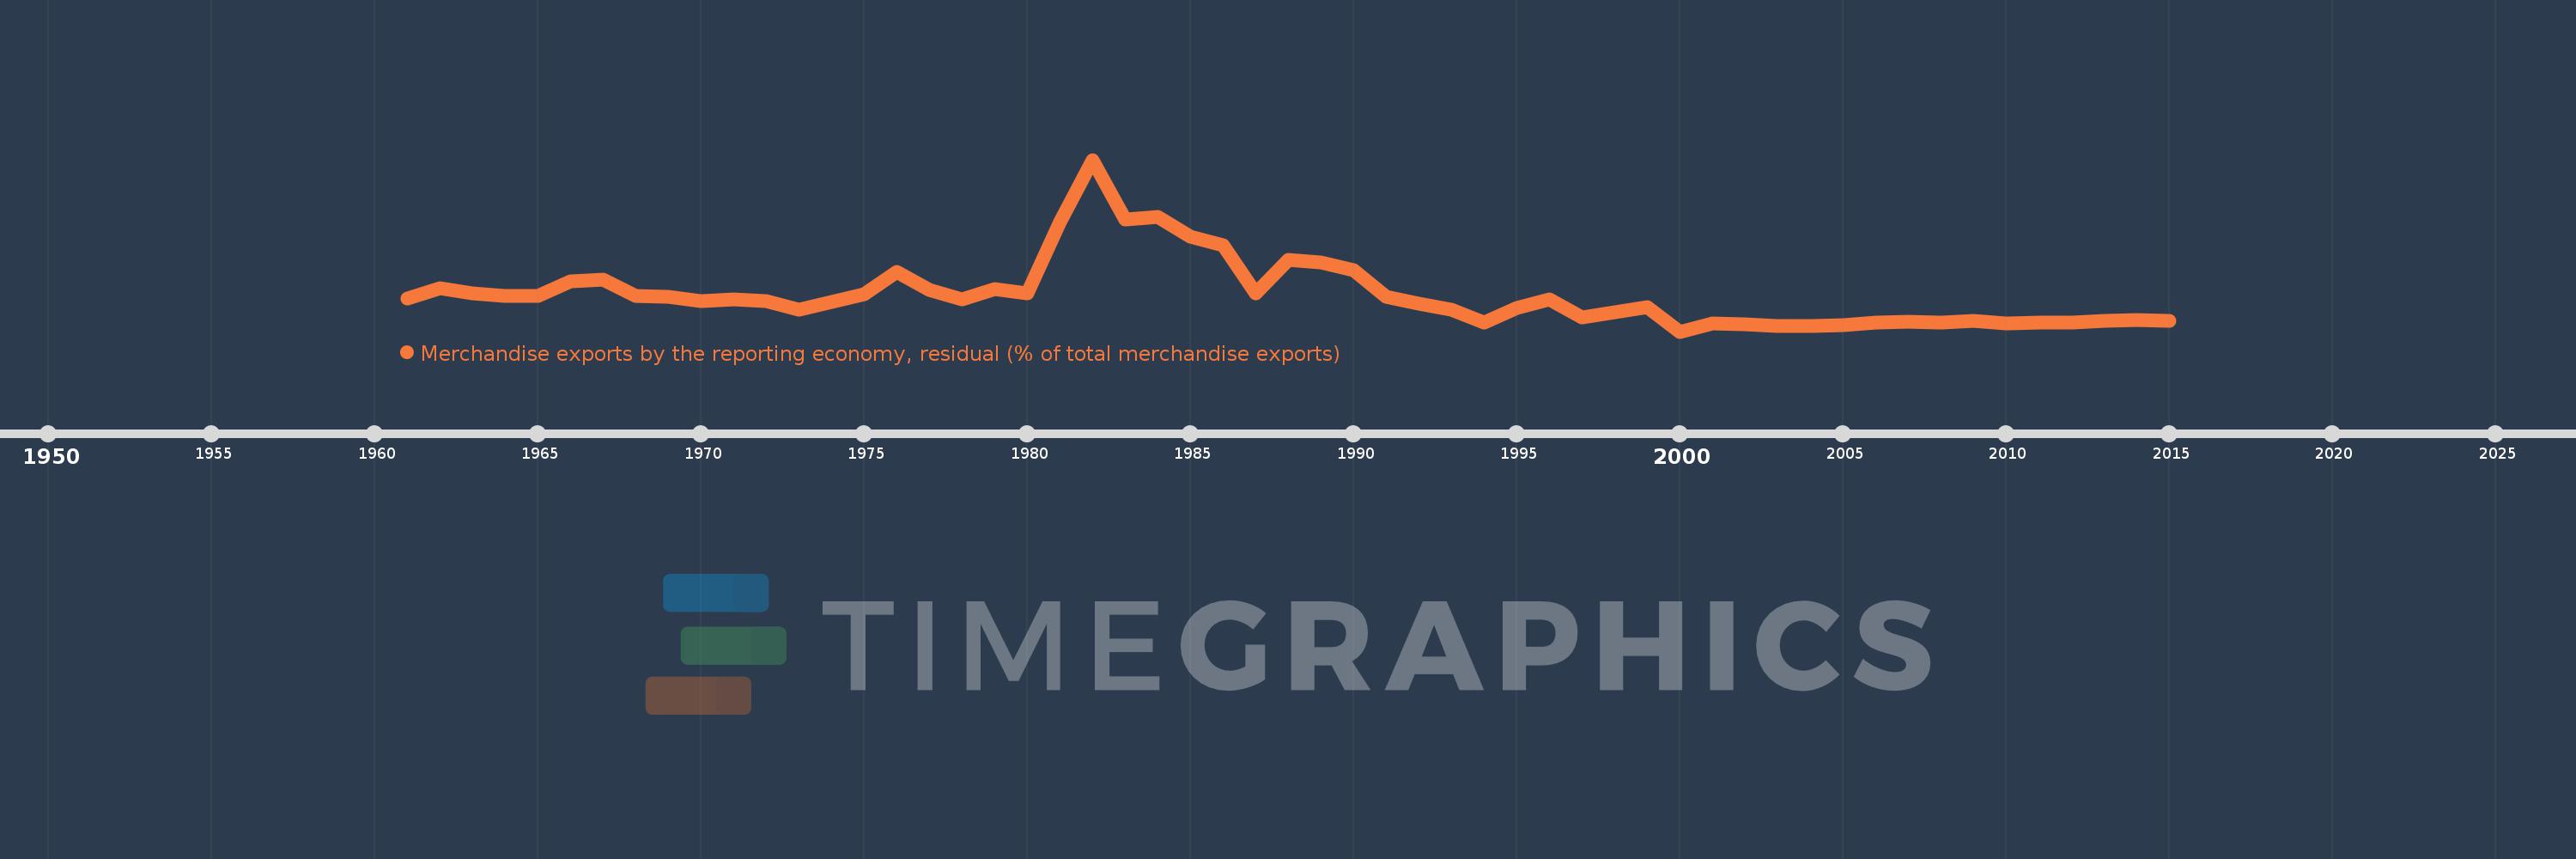
Merchandise exports by the reporting economy, residual (% of total merchandise exports)
2015,2014,2013,2012,2011,2010,2009,2008,2007,2006,2005,2004,2003,2002,2001,2000,1999,1998,1997,1996,1995,1994,1993,1992,1991,1990,1989,1988,1987,1986,1985,1984,1983,1982,1981,1980,1979,1978,1977,1976,1975,1974,1973,1972,1971,1970,1969,1968,1967,1966,1965,1964,1963,1962,1961
Estas estadísticas en otros países:
AfghanistanAlbaniaAlgeriaAmerican SamoaAngolaAntigua and BarbudaArab WorldArgentinaArmeniaArubaAustraliaAustriaAzerbaijanBahamas, TheBahrainBangladeshBarbadosBelarusBelgiumBelizeBeninBermudaBoliviaBosnia and HerzegovinaBrazilBrunei DarussalamBulgariaBurkina FasoBurundiCabo VerdeCambodiaCameroonCanadaCaribbean small statesCentral African RepublicCentral Europe and the BalticsChadChileChinaColombiaComorosCongo, Dem. Rep.Congo, Rep.Costa RicaCote d'IvoireCroatiaCubaCyprusCzech RepublicDenmarkDjiboutiDominicaDominican RepublicEarly-demographic dividendEast Asia & PacificEast Asia & Pacific (excluding high income)East Asia & Pacific (IDA & IBRD countries)EcuadorEgypt, Arab Rep.El SalvadorEquatorial GuineaEstoniaEthiopiaEuro areaEurope & Central AsiaEurope & Central Asia (excluding high income)Europe & Central Asia (IDA & IBRD countries)European UnionFaroe IslandsFijiFinlandFragile and conflict affected situationsFranceFrench PolynesiaGabonGambia, TheGeorgiaGermanyGhanaGibraltarGreeceGreenlandGrenadaGuamGuatemalaGuineaGuinea-BissauGuyanaHaitiHeavily indebted poor countries (HIPC)High incomeHondurasHong Kong SAR, ChinaHungaryIBRD onlyIcelandIDA & IBRD totalIDA blendIDA onlyIDA totalIndiaIndonesiaIran, Islamic Rep.IraqIrelandIsraelItalyJamaicaJapanJordanKazakhstanKenyaKiribatiKorea, Dem. People’s Rep.Korea, Rep.KosovoKuwaitKyrgyz RepublicLao PDRLate-demographic dividendLatin America & Caribbean Latin America & Caribbean (excluding high income)Latin America & the Caribbean (IDA & IBRD countries)LatviaLeast developed countries: UN classificationLebanonLiberiaLibyaLithuaniaLow & middle incomeLow incomeLower middle incomeLuxembourgMacao SAR, ChinaMacedonia, FYRMadagascarMalawiMalaysiaMaldivesMaliMaltaMauritaniaMauritiusMexicoMiddle East & North AfricaMiddle East & North Africa (excluding high income)Middle East & North Africa (IDA & IBRD countries)Middle incomeMoldovaMongoliaMontenegroMoroccoMozambiqueMyanmarNauruNepalNetherlandsNew CaledoniaNew ZealandNicaraguaNigerNigeriaNorth AmericaNorwayOECD membersOmanOther small statesPacific island small statesPakistanPanamaPapua New GuineaParaguayPeruPhilippinesPolandPortugalPost-demographic dividendPre-demographic dividendQatarRomaniaRussian FederationRwandaSamoaSao Tome and PrincipeSaudi ArabiaSenegalSerbiaSeychellesSierra LeoneSingaporeSlovak RepublicSloveniaSmall statesSolomon IslandsSomaliaSouth AfricaSouth AsiaSouth Asia (IDA & IBRD)SpainSri LankaSt. Kitts and NevisSt. LuciaSt. Vincent and the GrenadinesSub-Saharan Africa Sub-Saharan Africa (excluding high income)Sub-Saharan Africa (IDA & IBRD countries)SudanSurinameSwedenSwitzerlandSyrian Arab RepublicTajikistanTanzaniaThailandTogoTongaTrinidad and TobagoTunisiaTurkeyTurkmenistanTuvaluUgandaUkraineUnited Arab EmiratesUnited KingdomUnited StatesUpper middle incomeUruguayUzbekistanVanuatuVenezuela, RBVietnamWorldYemen, Rep.ZambiaZimbabwe línea de tiempo (timeline):
En esta escala de tiempo se presenta un gráfico de 1961 y 2015 de Argentina. Los datos de 1960 están ausentes. El número de observaciones reales por fecha: 55.
Fuente (nombre):
Indicadores del desarrollo mundial
Fuente (organización):
World Bank staff estimates based data from International Monetary Fund's Direction of Trade database.
Categorías:
Private Sector, Trade
Se ha actualizado:
23 abr 2017 año
Los indicadores de los cambios de valor en los últimos años
Mínimo:
0.086
1 ene 2000 año
Máximo:
34.454
1 ene 1982 año
A la fecha de observación
Valor
Cambio absoluto
El cambio con respecto al valor anterior
1 ene 1961 año
6.765
+6.765
0.0%
1 ene 1962 año
8.795
+2.03
30.01%
1 ene 1963 año
7.701
-1.094
-12.44%
1 ene 1964 año
7.256
-0.445
-5.77%
1 ene 1965 año
7.174
-0.082
-1.13%
1 ene 1966 año
10.2
+3.027
42.19%
1 ene 1967 año
10.545
+0.345
3.38%
1 ene 1968 año
7.244
-3.302
-31.31%
1 ene 1969 año
7.051
-0.193
-2.67%
1 ene 1970 año
6.26
-0.791
-11.21%
1 ene 1971 año
6.563
+0.303
4.83%
1 ene 1972 año
6.19
-0.373
-5.68%
1 ene 1973 año
4.529
-1.661
-26.83%
1 ene 1974 año
5.987
+1.458
32.2%
1 ene 1975 año
7.53
+1.543
25.77%
1 ene 1976 año
11.981
+4.451
59.1%
1 ene 1977 año
8.368
-3.613
-30.15%
1 ene 1978 año
6.458
-1.91
-22.83%
1 ene 1979 año
8.51
+2.051
31.76%
1 ene 1980 año
7.699
-0.811
-9.53%
1 ene 1981 año
22.065
+14.366
186.6%
1 ene 1982 año
34.454
+12.389
56.15%
1 ene 1983 año
22.431
-12.023
-34.9%
1 ene 1984 año
23.03
+0.599
2.67%
1 ene 1985 año
19.092
-3.938
-17.1%
1 ene 1986 año
17.399
-1.692
-8.86%
1 ene 1987 año
7.785
-9.614
-55.25%
1 ene 1988 año
14.395
+6.609
84.89%
1 ene 1989 año
13.872
-0.522
-3.63%
1 ene 1990 año
12.327
-1.546
-11.14%
1 ene 1991 año
7.123
-5.204
-42.21%
1 ene 1992 año
5.63
-1.493
-20.97%
1 ene 1993 año
4.398
-1.232
-21.88%
1 ene 1994 año
1.968
-2.43
-55.26%
1 ene 1995 año
4.727
+2.76
140.27%
1 ene 1996 año
6.506
+1.778
37.62%
1 ene 1997 año
2.974
-3.531
-54.28%
1 ene 1998 año
3.995
+1.02
34.31%
1 ene 1999 año
5.03
+1.035
25.92%
1 ene 2000 año
0.086
-4.944
-98.28%
1 ene 2001 año
1.732
+1.646
1.91 mil%
1 ene 2002 año
1.543
-0.189
-10.91%
1 ene 2003 año
1.12
-0.423
-27.42%
1 ene 2004 año
1.192
+0.072
6.39%
1 ene 2005 año
1.431
+0.24
20.1%
1 ene 2006 año
1.903
+0.472
32.96%
1 ene 2007 año
2.053
+0.15
7.9%
1 ene 2008 año
1.873
-0.181
-8.8%
1 ene 2009 año
2.303
+0.43
22.99%
1 ene 2010 año
1.696
-0.607
-26.35%
1 ene 2011 año
1.84
+0.143
8.45%
1 ene 2012 año
1.948
+0.108
5.9%
1 ene 2013 año
2.226
+0.278
14.26%
1 ene 2014 año
2.324
+0.098
4.39%
1 ene 2015 año
2.288
-0.036
-1.53%
Ranking de los países por los datos estadísticos actuales


Comentarios: