29
/es/
es
AIzaSyAYiBZKx7MnpbEhh9jyipgxe19OcubqV5w
April 1, 2024
153780
Iceland
ISL
true
2
1
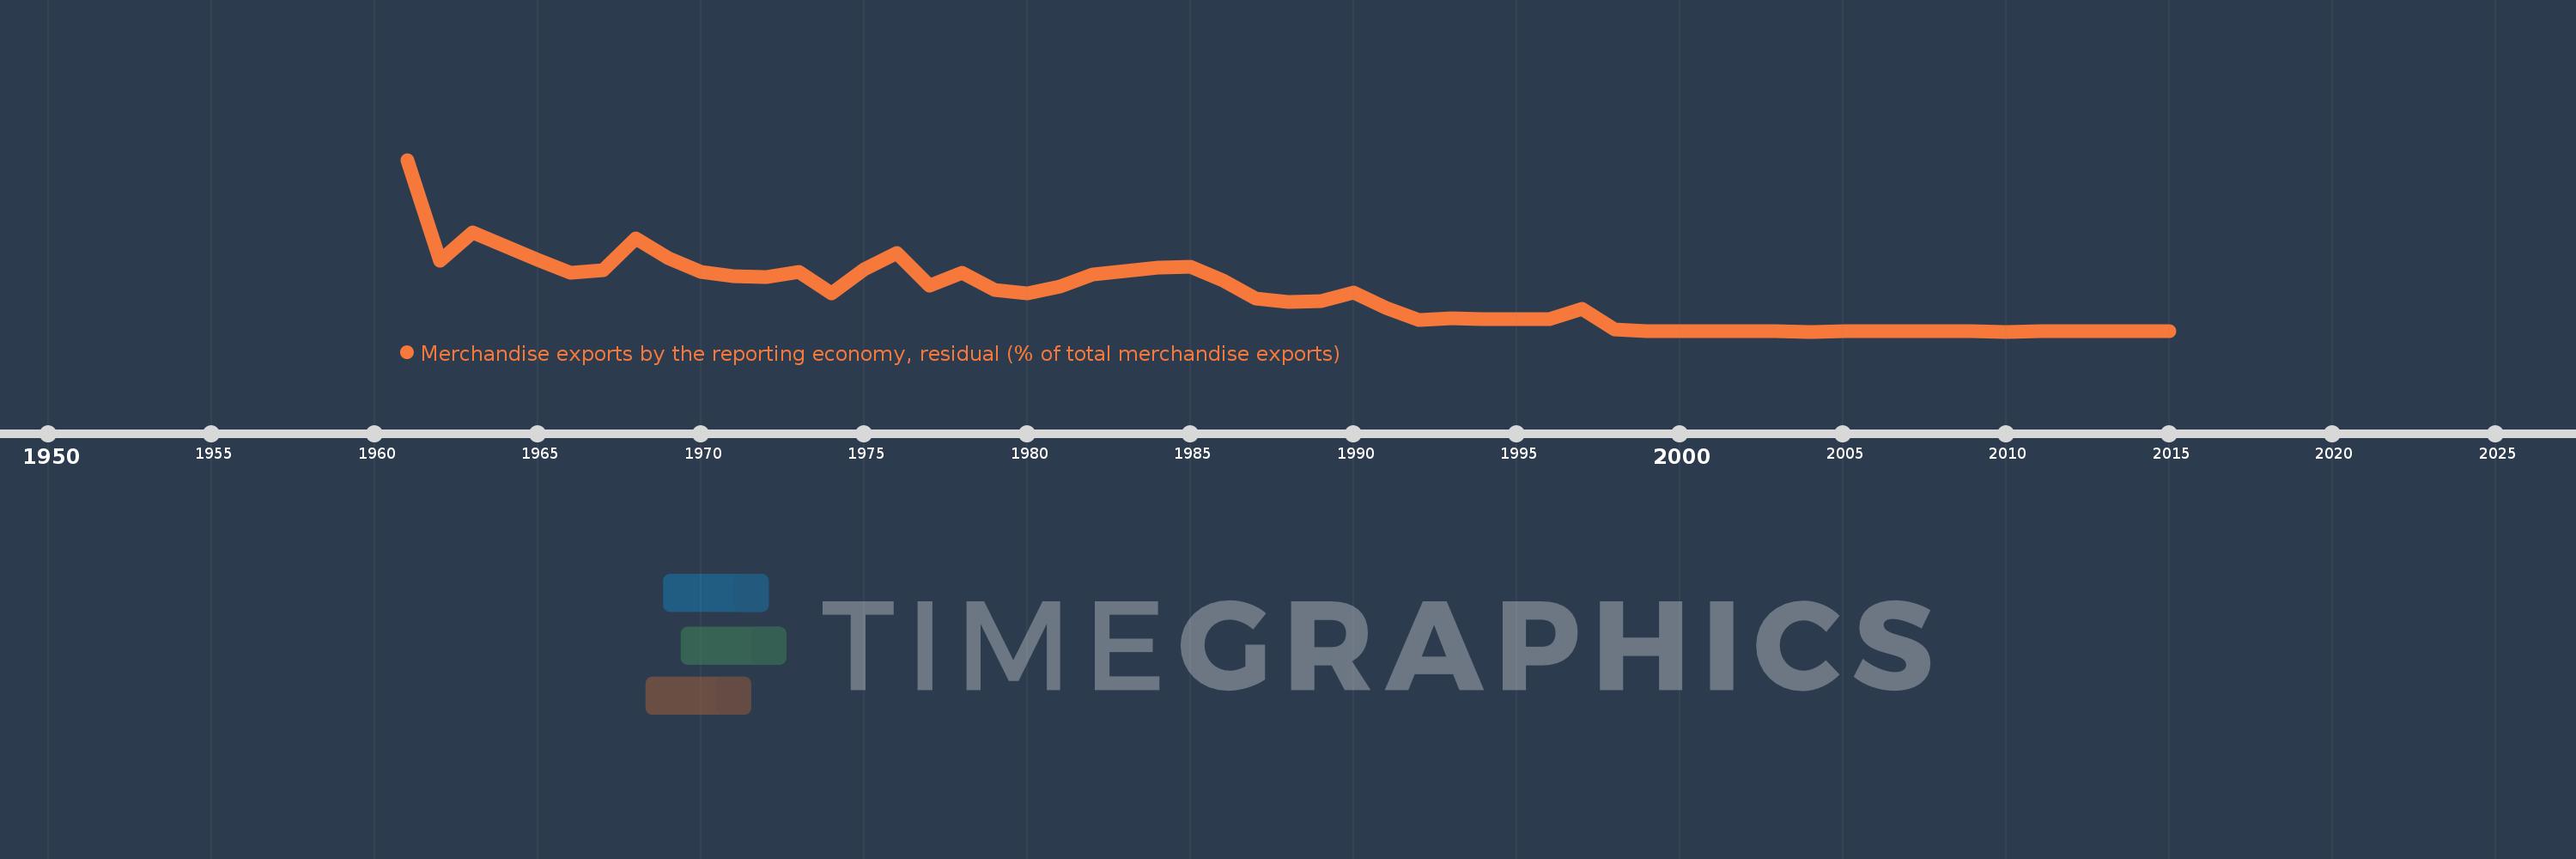
Merchandise exports by the reporting economy, residual (% of total merchandise exports)
2015,2014,2013,2012,2011,2010,2009,2008,2007,2006,2005,2004,2003,2002,2001,2000,1999,1998,1997,1996,1995,1994,1993,1992,1991,1990,1989,1988,1987,1986,1985,1984,1983,1982,1981,1980,1979,1978,1977,1976,1975,1974,1973,1972,1971,1970,1969,1968,1967,1966,1965,1964,1963,1962,1961
Estas estadísticas en otros países:
AfghanistanAlbaniaAlgeriaAmerican SamoaAngolaAntigua and BarbudaArab WorldArgentinaArmeniaArubaAustraliaAustriaAzerbaijanBahamas, TheBahrainBangladeshBarbadosBelarusBelgiumBelizeBeninBermudaBoliviaBosnia and HerzegovinaBrazilBrunei DarussalamBulgariaBurkina FasoBurundiCabo VerdeCambodiaCameroonCanadaCaribbean small statesCentral African RepublicCentral Europe and the BalticsChadChileChinaColombiaComorosCongo, Dem. Rep.Congo, Rep.Costa RicaCote d'IvoireCroatiaCubaCyprusCzech RepublicDenmarkDjiboutiDominicaDominican RepublicEarly-demographic dividendEast Asia & PacificEast Asia & Pacific (excluding high income)East Asia & Pacific (IDA & IBRD countries)EcuadorEgypt, Arab Rep.El SalvadorEquatorial GuineaEstoniaEthiopiaEuro areaEurope & Central AsiaEurope & Central Asia (excluding high income)Europe & Central Asia (IDA & IBRD countries)European UnionFaroe IslandsFijiFinlandFragile and conflict affected situationsFranceFrench PolynesiaGabonGambia, TheGeorgiaGermanyGhanaGibraltarGreeceGreenlandGrenadaGuamGuatemalaGuineaGuinea-BissauGuyanaHaitiHeavily indebted poor countries (HIPC)High incomeHondurasHong Kong SAR, ChinaHungaryIBRD onlyIcelandIDA & IBRD totalIDA blendIDA onlyIDA totalIndiaIndonesiaIran, Islamic Rep.IraqIrelandIsraelItalyJamaicaJapanJordanKazakhstanKenyaKiribatiKorea, Dem. People’s Rep.Korea, Rep.KosovoKuwaitKyrgyz RepublicLao PDRLate-demographic dividendLatin America & Caribbean Latin America & Caribbean (excluding high income)Latin America & the Caribbean (IDA & IBRD countries)LatviaLeast developed countries: UN classificationLebanonLiberiaLibyaLithuaniaLow & middle incomeLow incomeLower middle incomeLuxembourgMacao SAR, ChinaMacedonia, FYRMadagascarMalawiMalaysiaMaldivesMaliMaltaMauritaniaMauritiusMexicoMiddle East & North AfricaMiddle East & North Africa (excluding high income)Middle East & North Africa (IDA & IBRD countries)Middle incomeMoldovaMongoliaMontenegroMoroccoMozambiqueMyanmarNauruNepalNetherlandsNew CaledoniaNew ZealandNicaraguaNigerNigeriaNorth AmericaNorwayOECD membersOmanOther small statesPacific island small statesPakistanPanamaPapua New GuineaParaguayPeruPhilippinesPolandPortugalPost-demographic dividendPre-demographic dividendQatarRomaniaRussian FederationRwandaSamoaSao Tome and PrincipeSaudi ArabiaSenegalSerbiaSeychellesSierra LeoneSingaporeSlovak RepublicSloveniaSmall statesSolomon IslandsSomaliaSouth AfricaSouth AsiaSouth Asia (IDA & IBRD)SpainSri LankaSt. Kitts and NevisSt. LuciaSt. Vincent and the GrenadinesSub-Saharan Africa Sub-Saharan Africa (excluding high income)Sub-Saharan Africa (IDA & IBRD countries)SudanSurinameSwedenSwitzerlandSyrian Arab RepublicTajikistanTanzaniaThailandTogoTongaTrinidad and TobagoTunisiaTurkeyTurkmenistanTuvaluUgandaUkraineUnited Arab EmiratesUnited KingdomUnited StatesUpper middle incomeUruguayUzbekistanVanuatuVenezuela, RBVietnamWorldYemen, Rep.ZambiaZimbabwe línea de tiempo (timeline):
En esta escala de tiempo se presenta un gráfico de 1961 y 2015 de Iceland. Los datos de 1960 están ausentes. El número de observaciones reales por fecha: 55.
Fuente (nombre):
Indicadores del desarrollo mundial
Fuente (organización):
World Bank staff estimates based data from International Monetary Fund's Direction of Trade database.
Categorías:
Private Sector, Trade
Se ha actualizado:
23 abr 2017 año
Los indicadores de los cambios de valor en los últimos años
Mínimo:
0.003
1 ene 2010 año
Máximo:
28.659
1 ene 1961 año
A la fecha de observación
Valor
Cambio absoluto
El cambio con respecto al valor anterior
1 ene 1961 año
28.659
+28.659
0.0%
1 ene 1962 año
11.756
-16.902
-58.98%
1 ene 1963 año
16.587
+4.831
41.09%
1 ene 1964 año
14.301
-2.286
-13.78%
1 ene 1965 año
11.982
-2.319
-16.22%
1 ene 1966 año
9.76
-2.222
-18.55%
1 ene 1967 año
10.271
+0.511
5.24%
1 ene 1968 año
15.593
+5.321
51.81%
1 ene 1969 año
12.21
-3.383
-21.69%
1 ene 1970 año
9.948
-2.262
-18.53%
1 ene 1971 año
9.204
-0.744
-7.48%
1 ene 1972 año
9.122
-0.082
-0.89%
1 ene 1973 año
9.912
+0.79
8.66%
1 ene 1974 año
6.33
-3.582
-36.14%
1 ene 1975 año
10.344
+4.014
63.42%
1 ene 1976 año
13.153
+2.809
27.16%
1 ene 1977 año
7.635
-5.518
-41.95%
1 ene 1978 año
9.845
+2.21
28.95%
1 ene 1979 año
6.929
-2.916
-29.62%
1 ene 1980 año
6.319
-0.61
-8.8%
1 ene 1981 año
7.547
+1.228
19.43%
1 ene 1982 año
9.526
+1.978
26.21%
1 ene 1983 año
10.104
+0.579
6.07%
1 ene 1984 año
10.668
+0.564
5.58%
1 ene 1985 año
10.869
+0.2
1.88%
1 ene 1986 año
8.571
-2.298
-21.14%
1 ene 1987 año
5.563
-3.008
-35.1%
1 ene 1988 año
5.014
-0.549
-9.87%
1 ene 1989 año
5.021
+0.007
0.14%
1 ene 1990 año
6.56
+1.539
30.65%
1 ene 1991 año
3.938
-2.621
-39.96%
1 ene 1992 año
2.004
-1.934
-49.12%
1 ene 1993 año
2.179
+0.175
8.75%
1 ene 1994 año
2.145
-0.034
-1.58%
1 ene 1995 año
2.093
-0.052
-2.41%
1 ene 1996 año
2.104
+0.011
0.51%
1 ene 1997 año
3.729
+1.625
77.27%
1 ene 1998 año
0.409
-3.32
-89.04%
1 ene 1999 año
0.036
-0.373
-91.18%
1 ene 2000 año
0.005
-0.031
-87.1%
1 ene 2001 año
0.023
+0.018
388.1%
1 ene 2002 año
0.031
+0.009
37.71%
1 ene 2003 año
0.037
+0.006
18.4%
1 ene 2004 año
0.003
-0.034
-91.2%
1 ene 2005 año
0.011
+0.007
227.21%
1 ene 2006 año
0.009
-0.001
-11.64%
1 ene 2007 año
0.014
+0.005
48.53%
1 ene 2008 año
0.037
+0.023
163.5%
1 ene 2009 año
0.018
-0.018
-49.89%
1 ene 2010 año
0.003
-0.016
-85.94%
1 ene 2011 año
0.006
+0.004
134.87%
1 ene 2012 año
0.038
+0.032
521.6%
1 ene 2013 año
0.014
-0.024
-64.13%
1 ene 2014 año
0.113
+0.099
728.83%
1 ene 2015 año
0.036
-0.077
-68.42%
Ranking de los países por los datos estadísticos actuales


Comentarios: