29
/es/
es
AIzaSyAYiBZKx7MnpbEhh9jyipgxe19OcubqV5w
April 1, 2024
41658
Latin America & Caribbean
LCN
false
2
1
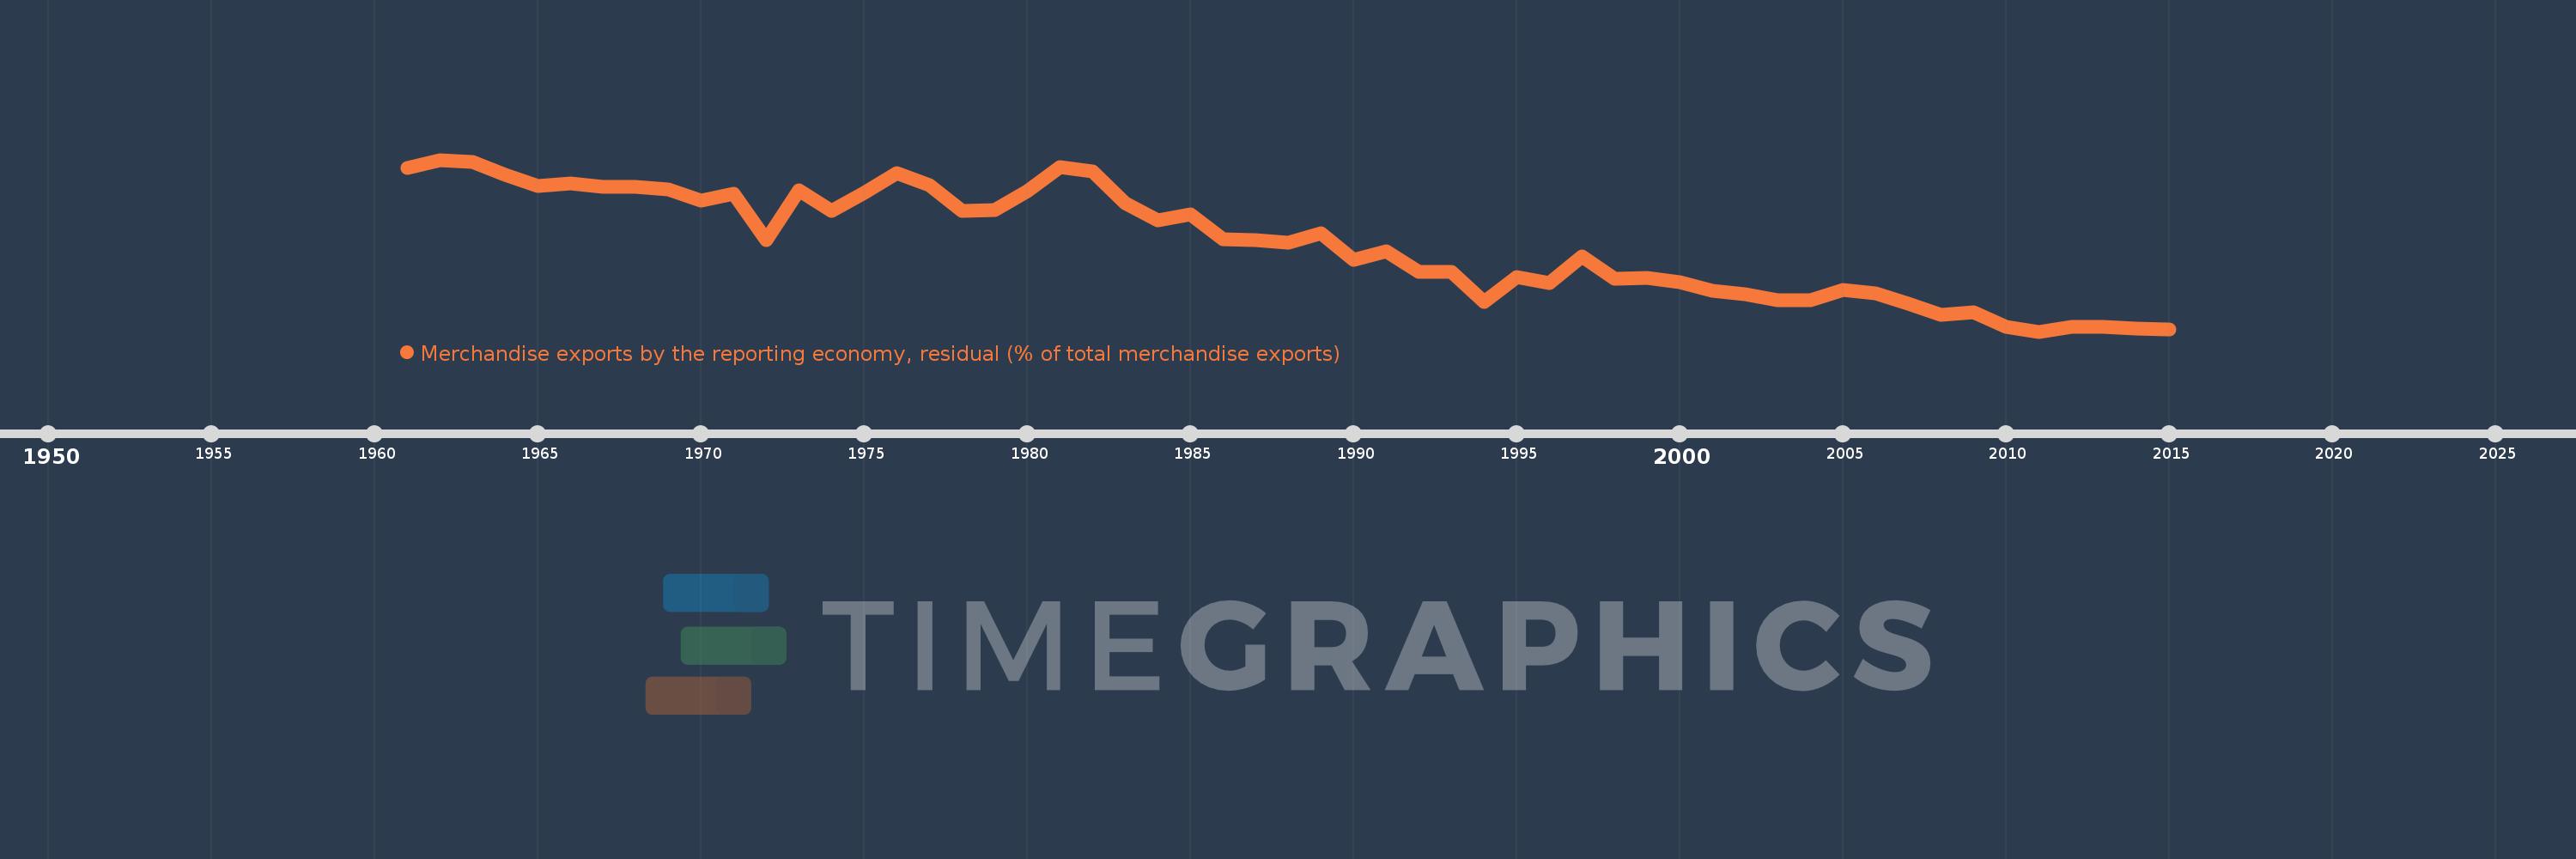
Merchandise exports by the reporting economy, residual (% of total merchandise exports)
2015,2014,2013,2012,2011,2010,2009,2008,2007,2006,2005,2004,2003,2002,2001,2000,1999,1998,1997,1996,1995,1994,1993,1992,1991,1990,1989,1988,1987,1986,1985,1984,1983,1982,1981,1980,1979,1978,1977,1976,1975,1974,1973,1972,1971,1970,1969,1968,1967,1966,1965,1964,1963,1962,1961
Estas estadísticas en otros países:
AfghanistanAlbaniaAlgeriaAmerican SamoaAngolaAntigua and BarbudaArab WorldArgentinaArmeniaArubaAustraliaAustriaAzerbaijanBahamas, TheBahrainBangladeshBarbadosBelarusBelgiumBelizeBeninBermudaBoliviaBosnia and HerzegovinaBrazilBrunei DarussalamBulgariaBurkina FasoBurundiCabo VerdeCambodiaCameroonCanadaCaribbean small statesCentral African RepublicCentral Europe and the BalticsChadChileChinaColombiaComorosCongo, Dem. Rep.Congo, Rep.Costa RicaCote d'IvoireCroatiaCubaCyprusCzech RepublicDenmarkDjiboutiDominicaDominican RepublicEarly-demographic dividendEast Asia & PacificEast Asia & Pacific (excluding high income)East Asia & Pacific (IDA & IBRD countries)EcuadorEgypt, Arab Rep.El SalvadorEquatorial GuineaEstoniaEthiopiaEuro areaEurope & Central AsiaEurope & Central Asia (excluding high income)Europe & Central Asia (IDA & IBRD countries)European UnionFaroe IslandsFijiFinlandFragile and conflict affected situationsFranceFrench PolynesiaGabonGambia, TheGeorgiaGermanyGhanaGibraltarGreeceGreenlandGrenadaGuamGuatemalaGuineaGuinea-BissauGuyanaHaitiHeavily indebted poor countries (HIPC)High incomeHondurasHong Kong SAR, ChinaHungaryIBRD onlyIcelandIDA & IBRD totalIDA blendIDA onlyIDA totalIndiaIndonesiaIran, Islamic Rep.IraqIrelandIsraelItalyJamaicaJapanJordanKazakhstanKenyaKiribatiKorea, Dem. People’s Rep.Korea, Rep.KosovoKuwaitKyrgyz RepublicLao PDRLate-demographic dividendLatin America & Caribbean Latin America & Caribbean (excluding high income)Latin America & the Caribbean (IDA & IBRD countries)LatviaLeast developed countries: UN classificationLebanonLiberiaLibyaLithuaniaLow & middle incomeLow incomeLower middle incomeLuxembourgMacao SAR, ChinaMacedonia, FYRMadagascarMalawiMalaysiaMaldivesMaliMaltaMauritaniaMauritiusMexicoMiddle East & North AfricaMiddle East & North Africa (excluding high income)Middle East & North Africa (IDA & IBRD countries)Middle incomeMoldovaMongoliaMontenegroMoroccoMozambiqueMyanmarNauruNepalNetherlandsNew CaledoniaNew ZealandNicaraguaNigerNigeriaNorth AmericaNorwayOECD membersOmanOther small statesPacific island small statesPakistanPanamaPapua New GuineaParaguayPeruPhilippinesPolandPortugalPost-demographic dividendPre-demographic dividendQatarRomaniaRussian FederationRwandaSamoaSao Tome and PrincipeSaudi ArabiaSenegalSerbiaSeychellesSierra LeoneSingaporeSlovak RepublicSloveniaSmall statesSolomon IslandsSomaliaSouth AfricaSouth AsiaSouth Asia (IDA & IBRD)SpainSri LankaSt. Kitts and NevisSt. LuciaSt. Vincent and the GrenadinesSub-Saharan Africa Sub-Saharan Africa (excluding high income)Sub-Saharan Africa (IDA & IBRD countries)SudanSurinameSwedenSwitzerlandSyrian Arab RepublicTajikistanTanzaniaThailandTogoTongaTrinidad and TobagoTunisiaTurkeyTurkmenistanTuvaluUgandaUkraineUnited Arab EmiratesUnited KingdomUnited StatesUpper middle incomeUruguayUzbekistanVanuatuVenezuela, RBVietnamWorldYemen, Rep.ZambiaZimbabwe línea de tiempo (timeline):
En esta escala de tiempo se presenta un gráfico de 1961 y 2015 de Latin America & Caribbean . Los datos de 1960 están ausentes. El número de observaciones reales por fecha: 55.
Fuente (nombre):
Indicadores del desarrollo mundial
Fuente (organización):
World Bank staff estimates based data from International Monetary Fund's Direction of Trade database.
Categorías:
Private Sector, Trade
Se ha actualizado:
23 abr 2017 año
Los indicadores de los cambios de valor en los últimos años
Mínimo:
1.874
1 ene 2011 año
Máximo:
13.642
1 ene 1962 año
A la fecha de observación
Valor
Cambio absoluto
El cambio con respecto al valor anterior
1 ene 1961 año
13.079
+13.079
0.0%
1 ene 1962 año
13.642
+0.562
4.3%
1 ene 1963 año
13.52
-0.122
-0.89%
1 ene 1964 año
12.629
-0.891
-6.59%
1 ene 1965 año
11.873
-0.756
-5.98%
1 ene 1966 año
12.018
+0.145
1.22%
1 ene 1967 año
11.792
-0.226
-1.88%
1 ene 1968 año
11.763
-0.029
-0.24%
1 ene 1969 año
11.639
-0.124
-1.06%
1 ene 1970 año
10.868
-0.771
-6.63%
1 ene 1971 año
11.314
+0.447
4.11%
1 ene 1972 año
8.139
-3.175
-28.06%
1 ene 1973 año
11.537
+3.398
41.75%
1 ene 1974 año
10.142
-1.395
-12.09%
1 ene 1975 año
11.383
+1.241
12.23%
1 ene 1976 año
12.702
+1.319
11.59%
1 ene 1977 año
11.882
-0.82
-6.45%
1 ene 1978 año
10.134
-1.748
-14.71%
1 ene 1979 año
10.219
+0.086
0.84%
1 ene 1980 año
11.477
+1.258
12.31%
1 ene 1981 año
13.129
+1.651
14.39%
1 ene 1982 año
12.87
-0.258
-1.97%
1 ene 1983 año
10.658
-2.213
-17.19%
1 ene 1984 año
9.506
-1.152
-10.81%
1 ene 1985 año
9.885
+0.379
3.99%
1 ene 1986 año
8.224
-1.66
-16.8%
1 ene 1987 año
8.118
-0.106
-1.29%
1 ene 1988 año
7.978
-0.14
-1.72%
1 ene 1989 año
8.602
+0.624
7.82%
1 ene 1990 año
6.812
-1.79
-20.81%
1 ene 1991 año
7.348
+0.535
7.86%
1 ene 1992 año
5.964
-1.384
-18.83%
1 ene 1993 año
5.979
+0.015
0.26%
1 ene 1994 año
3.897
-2.083
-34.83%
1 ene 1995 año
5.632
+1.735
44.53%
1 ene 1996 año
5.216
-0.415
-7.37%
1 ene 1997 año
7.043
+1.827
35.03%
1 ene 1998 año
5.48
-1.564
-22.2%
1 ene 1999 año
5.544
+0.064
1.17%
1 ene 2000 año
5.262
-0.282
-5.08%
1 ene 2001 año
4.674
-0.588
-11.17%
1 ene 2002 año
4.432
-0.242
-5.18%
1 ene 2003 año
4.005
-0.428
-9.64%
1 ene 2004 año
4.025
+0.02
0.5%
1 ene 2005 año
4.724
+0.699
17.36%
1 ene 2006 año
4.488
-0.235
-4.98%
1 ene 2007 año
3.779
-0.709
-15.8%
1 ene 2008 año
3.009
-0.77
-20.38%
1 ene 2009 año
3.171
+0.162
5.4%
1 ene 2010 año
2.223
-0.948
-29.91%
1 ene 2011 año
1.874
-0.349
-15.71%
1 ene 2012 año
2.198
+0.324
17.32%
1 ene 2013 año
2.181
-0.018
-0.8%
1 ene 2014 año
2.079
-0.101
-4.65%
1 ene 2015 año
2.041
-0.039
-1.85%
Ranking de los países por los datos estadísticos actuales


Comentarios: