29
/es/
es
AIzaSyAYiBZKx7MnpbEhh9jyipgxe19OcubqV5w
April 1, 2024
272526
Uganda
UGA
true
2
1
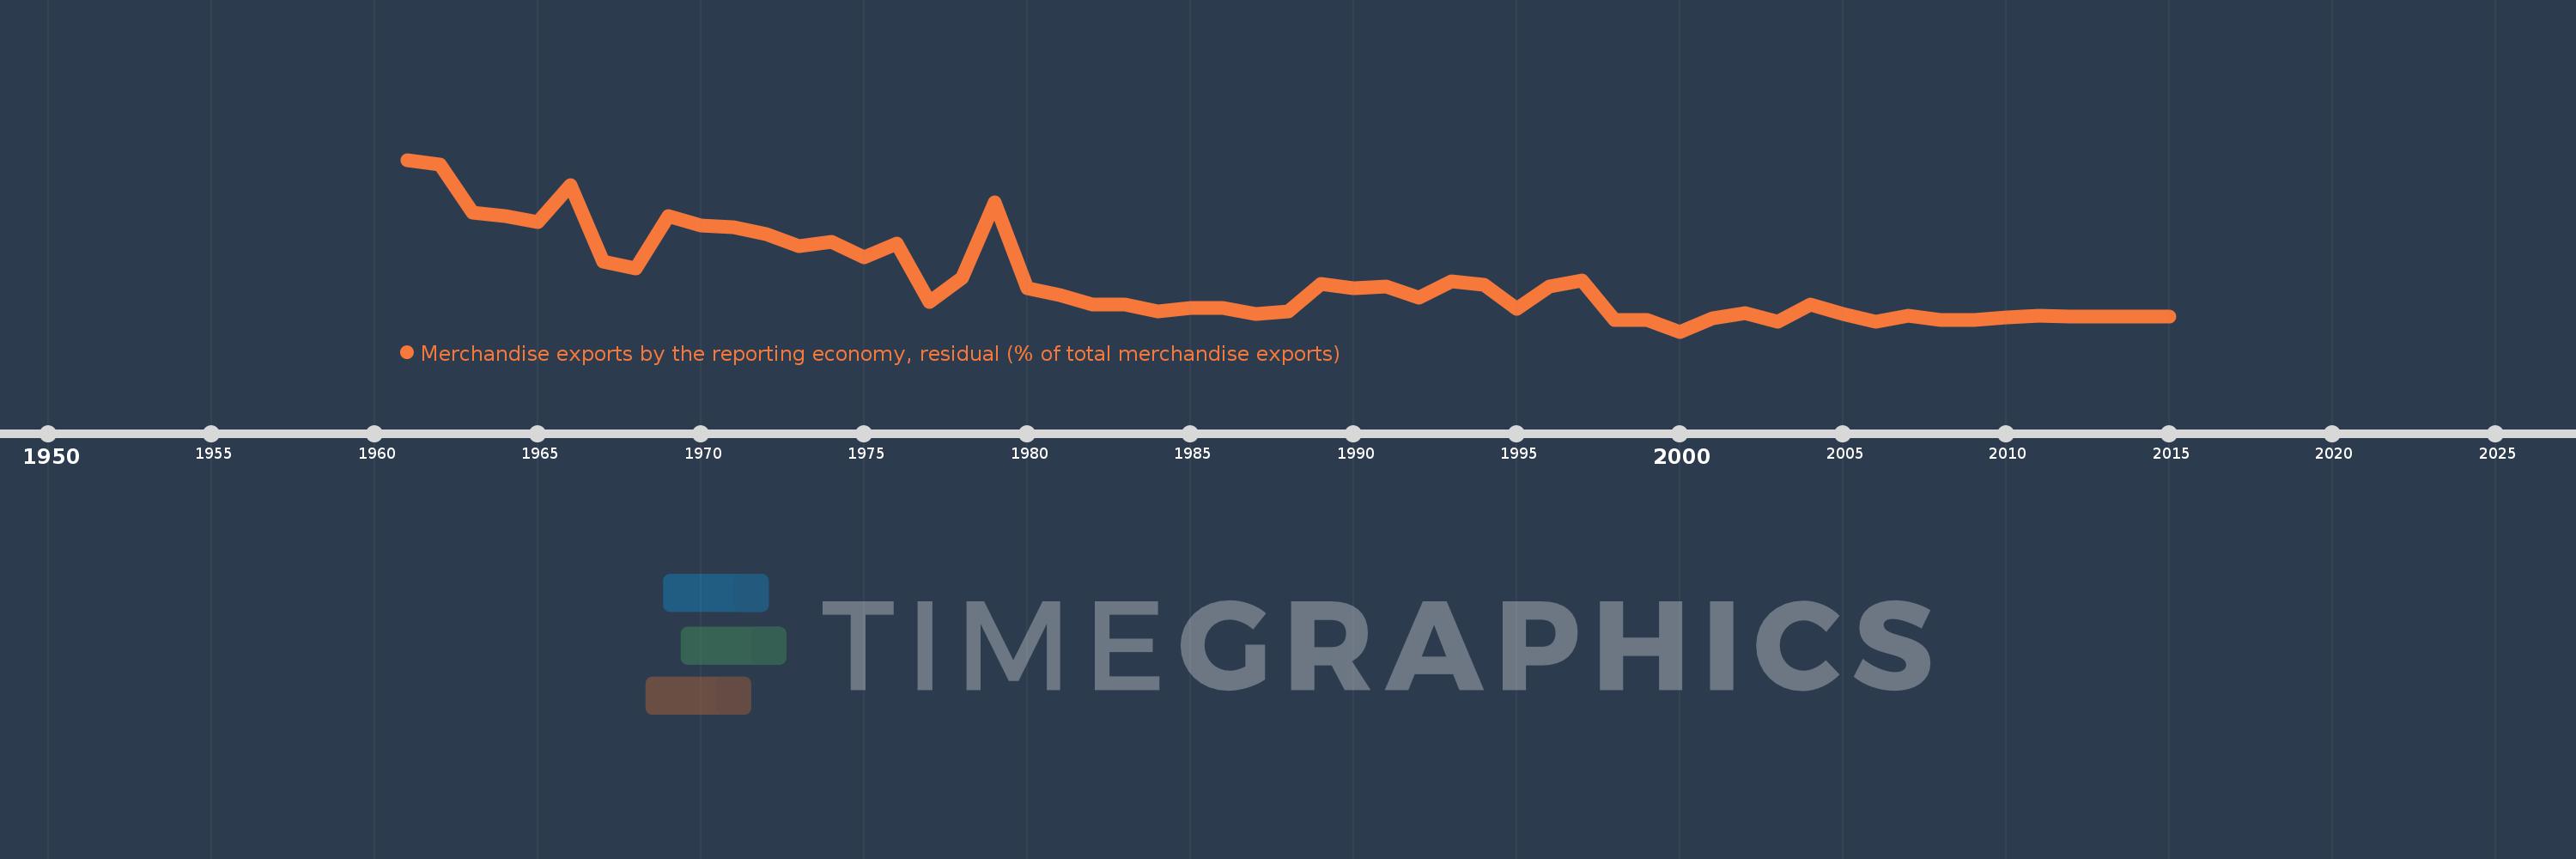
Merchandise exports by the reporting economy, residual (% of total merchandise exports)
2015,2014,2013,2012,2011,2010,2009,2008,2007,2006,2005,2004,2003,2002,2001,2000,1999,1998,1997,1996,1995,1994,1993,1992,1991,1990,1989,1988,1987,1986,1985,1984,1983,1982,1981,1980,1979,1978,1977,1976,1975,1974,1973,1972,1971,1970,1969,1968,1967,1966,1965,1964,1963,1962,1961
Estas estadísticas en otros países:
AfghanistanAlbaniaAlgeriaAmerican SamoaAngolaAntigua and BarbudaArab WorldArgentinaArmeniaArubaAustraliaAustriaAzerbaijanBahamas, TheBahrainBangladeshBarbadosBelarusBelgiumBelizeBeninBermudaBoliviaBosnia and HerzegovinaBrazilBrunei DarussalamBulgariaBurkina FasoBurundiCabo VerdeCambodiaCameroonCanadaCaribbean small statesCentral African RepublicCentral Europe and the BalticsChadChileChinaColombiaComorosCongo, Dem. Rep.Congo, Rep.Costa RicaCote d'IvoireCroatiaCubaCyprusCzech RepublicDenmarkDjiboutiDominicaDominican RepublicEarly-demographic dividendEast Asia & PacificEast Asia & Pacific (excluding high income)East Asia & Pacific (IDA & IBRD countries)EcuadorEgypt, Arab Rep.El SalvadorEquatorial GuineaEstoniaEthiopiaEuro areaEurope & Central AsiaEurope & Central Asia (excluding high income)Europe & Central Asia (IDA & IBRD countries)European UnionFaroe IslandsFijiFinlandFragile and conflict affected situationsFranceFrench PolynesiaGabonGambia, TheGeorgiaGermanyGhanaGibraltarGreeceGreenlandGrenadaGuamGuatemalaGuineaGuinea-BissauGuyanaHaitiHeavily indebted poor countries (HIPC)High incomeHondurasHong Kong SAR, ChinaHungaryIBRD onlyIcelandIDA & IBRD totalIDA blendIDA onlyIDA totalIndiaIndonesiaIran, Islamic Rep.IraqIrelandIsraelItalyJamaicaJapanJordanKazakhstanKenyaKiribatiKorea, Dem. People’s Rep.Korea, Rep.KosovoKuwaitKyrgyz RepublicLao PDRLate-demographic dividendLatin America & Caribbean Latin America & Caribbean (excluding high income)Latin America & the Caribbean (IDA & IBRD countries)LatviaLeast developed countries: UN classificationLebanonLiberiaLibyaLithuaniaLow & middle incomeLow incomeLower middle incomeLuxembourgMacao SAR, ChinaMacedonia, FYRMadagascarMalawiMalaysiaMaldivesMaliMaltaMauritaniaMauritiusMexicoMiddle East & North AfricaMiddle East & North Africa (excluding high income)Middle East & North Africa (IDA & IBRD countries)Middle incomeMoldovaMongoliaMontenegroMoroccoMozambiqueMyanmarNauruNepalNetherlandsNew CaledoniaNew ZealandNicaraguaNigerNigeriaNorth AmericaNorwayOECD membersOmanOther small statesPacific island small statesPakistanPanamaPapua New GuineaParaguayPeruPhilippinesPolandPortugalPost-demographic dividendPre-demographic dividendQatarRomaniaRussian FederationRwandaSamoaSao Tome and PrincipeSaudi ArabiaSenegalSerbiaSeychellesSierra LeoneSingaporeSlovak RepublicSloveniaSmall statesSolomon IslandsSomaliaSouth AfricaSouth AsiaSouth Asia (IDA & IBRD)SpainSri LankaSt. Kitts and NevisSt. LuciaSt. Vincent and the GrenadinesSub-Saharan Africa Sub-Saharan Africa (excluding high income)Sub-Saharan Africa (IDA & IBRD countries)SudanSurinameSwedenSwitzerlandSyrian Arab RepublicTajikistanTanzaniaThailandTogoTongaTrinidad and TobagoTunisiaTurkeyTurkmenistanTuvaluUgandaUkraineUnited Arab EmiratesUnited KingdomUnited StatesUpper middle incomeUruguayUzbekistanVanuatuVenezuela, RBVietnamWorldYemen, Rep.ZambiaZimbabwe línea de tiempo (timeline):
En esta escala de tiempo se presenta un gráfico de 1961 y 2015 de Uganda. Los datos de 1960 están ausentes. El número de observaciones reales por fecha: 55.
Fuente (nombre):
Indicadores del desarrollo mundial
Fuente (organización):
World Bank staff estimates based data from International Monetary Fund's Direction of Trade database.
Categorías:
Private Sector, Trade
Se ha actualizado:
23 abr 2017 año
Los indicadores de los cambios de valor en los últimos años
Máximo:
41.465
1 ene 1961 año
A la fecha de observación
Valor
Cambio absoluto
El cambio con respecto al valor anterior
1 ene 1961 año
41.465
+41.465
0.0%
1 ene 1962 año
40.261
-1.205
-2.91%
1 ene 1963 año
28.785
-11.476
-28.5%
1 ene 1964 año
27.937
-0.848
-2.95%
1 ene 1965 año
26.466
-1.471
-5.27%
1 ene 1966 año
35.442
+8.976
33.92%
1 ene 1967 año
16.889
-18.554
-52.35%
1 ene 1968 año
15.213
-1.676
-9.92%
1 ene 1969 año
27.835
+12.622
82.97%
1 ene 1970 año
25.693
-2.142
-7.69%
1 ene 1971 año
25.274
-0.419
-1.63%
1 ene 1972 año
23.495
-1.779
-7.04%
1 ene 1973 año
20.553
-2.942
-12.52%
1 ene 1974 año
21.601
+1.048
5.1%
1 ene 1975 año
18.015
-3.586
-16.6%
1 ene 1976 año
21.317
+3.301
18.33%
1 ene 1977 año
7.218
-14.099
-66.14%
1 ene 1978 año
13.027
+5.809
80.49%
1 ene 1979 año
31.278
+18.25
140.1%
1 ene 1980 año
10.401
-20.877
-66.75%
1 ene 1981 año
8.815
-1.585
-15.24%
1 ene 1982 año
6.433
-2.382
-27.02%
1 ene 1983 año
6.435
+0.002
0.03%
1 ene 1984 año
4.778
-1.658
-25.76%
1 ene 1985 año
5.739
+0.961
20.12%
1 ene 1986 año
5.609
-0.13
-2.26%
1 ene 1987 año
4.254
-1.355
-24.16%
1 ene 1988 año
4.947
+0.694
16.31%
1 ene 1989 año
11.467
+6.52
131.78%
1 ene 1990 año
10.513
-0.954
-8.32%
1 ene 1991 año
10.928
+0.415
3.95%
1 ene 1992 año
8.223
-2.705
-24.75%
1 ene 1993 año
12.192
+3.969
48.26%
1 ene 1994 año
11.317
-0.875
-7.18%
1 ene 1995 año
5.564
-5.753
-50.83%
1 ene 1996 año
10.885
+5.321
95.62%
1 ene 1997 año
12.422
+1.537
14.12%
1 ene 1998 año
2.792
-9.63
-77.53%
1 ene 1999 año
2.747
-0.045
-1.6%
1 ene 2000 año
0.0
-2.747
-100.0%
1 ene 2001 año
3.123
+3.123
-20.02 billones%
1 ene 2002 año
4.404
+1.281
41.03%
1 ene 2003 año
2.287
-2.117
-48.07%
1 ene 2004 año
6.592
+4.305
188.25%
1 ene 2005 año
4.237
-2.355
-35.73%
1 ene 2006 año
2.295
-1.942
-45.84%
1 ene 2007 año
3.811
+1.517
66.09%
1 ene 2008 año
2.824
-0.987
-25.89%
1 ene 2009 año
2.82
-0.005
-0.17%
1 ene 2010 año
3.462
+0.643
22.8%
1 ene 2011 año
3.857
+0.395
11.39%
1 ene 2012 año
3.654
-0.203
-5.26%
1 ene 2013 año
3.724
+0.07
1.91%
1 ene 2014 año
3.636
-0.088
-2.36%
1 ene 2015 año
3.594
-0.042
-1.15%
Ranking de los países por los datos estadísticos actuales


Comentarios: