29
/es/
es
AIzaSyAYiBZKx7MnpbEhh9jyipgxe19OcubqV5w
April 1, 2024
142584
Greenland
GRL
true
2
1
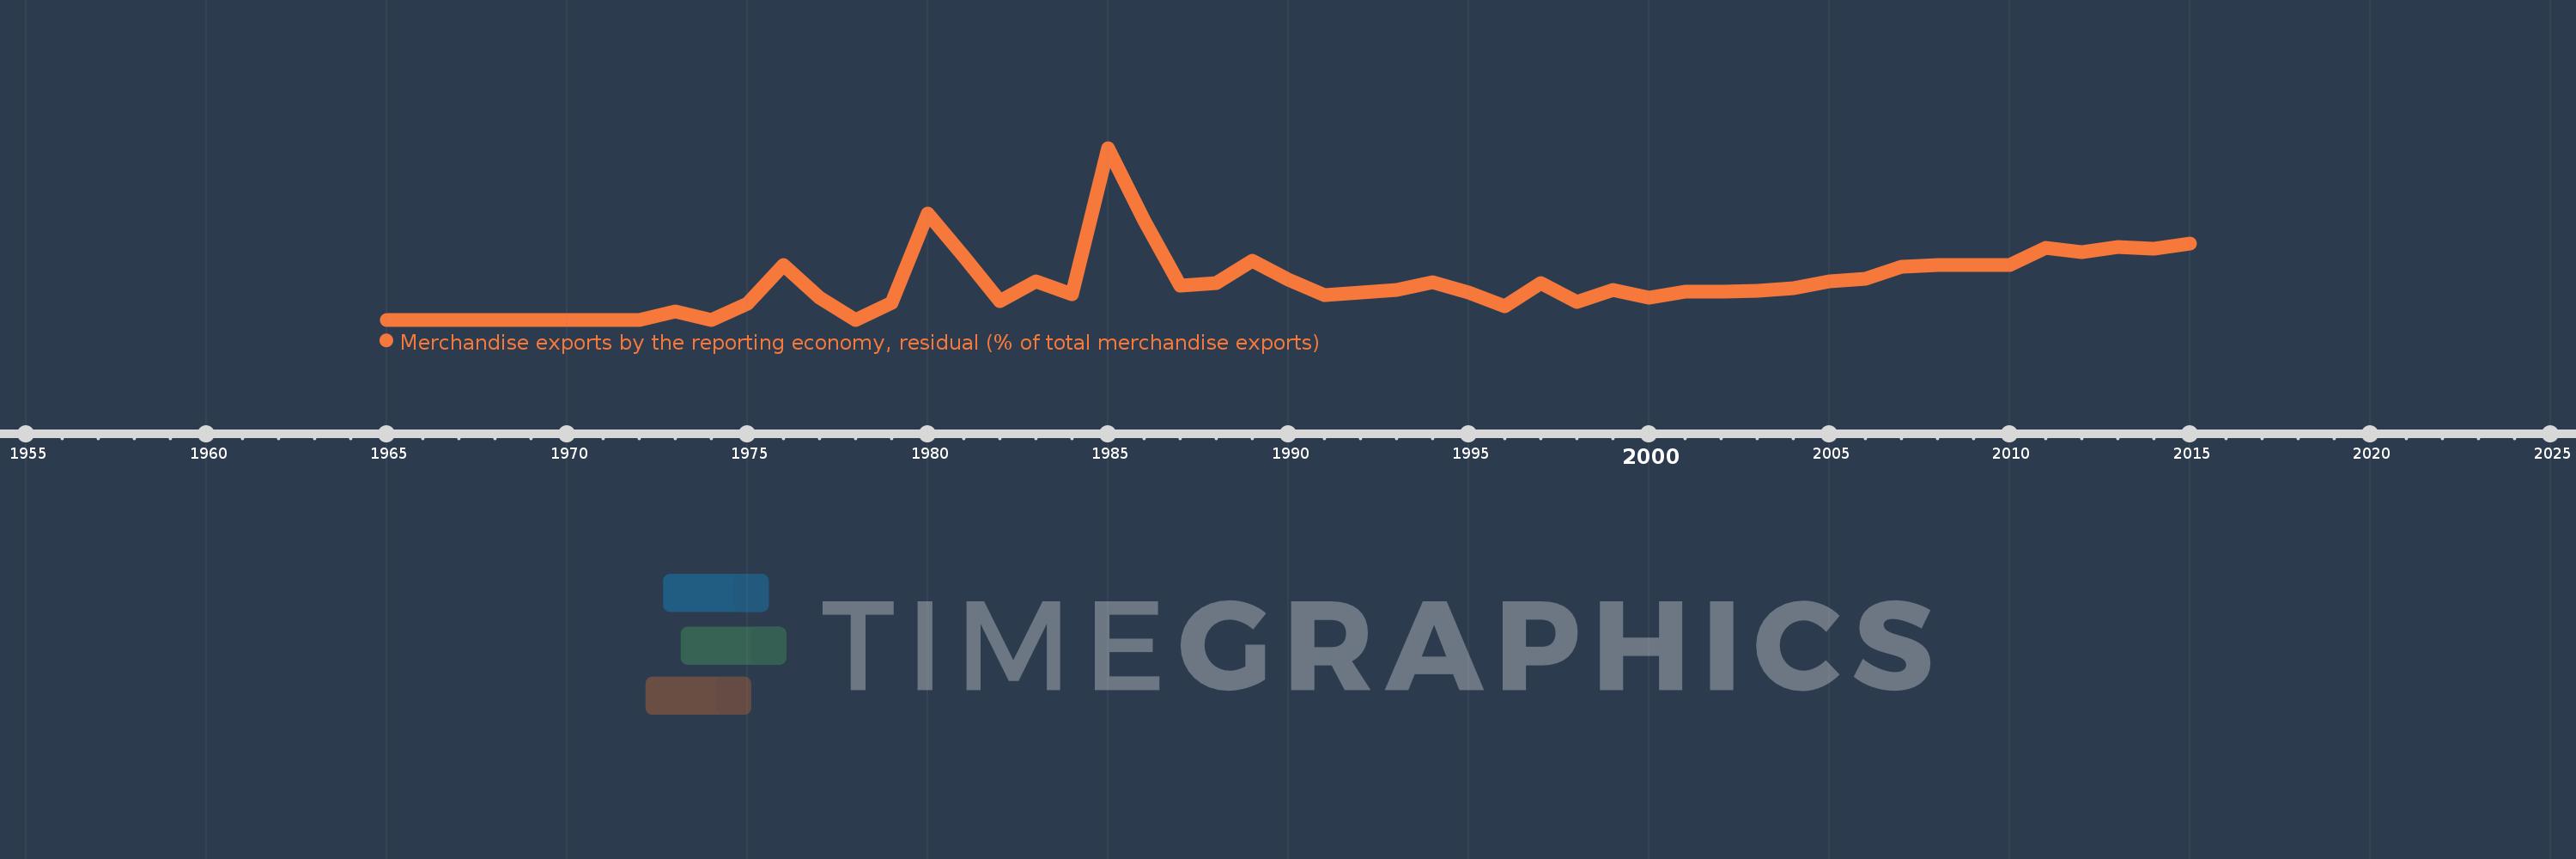
Merchandise exports by the reporting economy, residual (% of total merchandise exports)
2015,2014,2013,2012,2011,2010,2009,2008,2007,2006,2005,2004,2003,2002,2001,2000,1999,1998,1997,1996,1995,1994,1993,1992,1991,1990,1989,1988,1987,1986,1985,1984,1983,1982,1981,1980,1979,1978,1977,1976,1975,1974,1973,1972,1971,1970,1969,1968,1967,1966,1965
Estas estadísticas en otros países:
AfghanistanAlbaniaAlgeriaAmerican SamoaAngolaAntigua and BarbudaArab WorldArgentinaArmeniaArubaAustraliaAustriaAzerbaijanBahamas, TheBahrainBangladeshBarbadosBelarusBelgiumBelizeBeninBermudaBoliviaBosnia and HerzegovinaBrazilBrunei DarussalamBulgariaBurkina FasoBurundiCabo VerdeCambodiaCameroonCanadaCaribbean small statesCentral African RepublicCentral Europe and the BalticsChadChileChinaColombiaComorosCongo, Dem. Rep.Congo, Rep.Costa RicaCote d'IvoireCroatiaCubaCyprusCzech RepublicDenmarkDjiboutiDominicaDominican RepublicEarly-demographic dividendEast Asia & PacificEast Asia & Pacific (excluding high income)East Asia & Pacific (IDA & IBRD countries)EcuadorEgypt, Arab Rep.El SalvadorEquatorial GuineaEstoniaEthiopiaEuro areaEurope & Central AsiaEurope & Central Asia (excluding high income)Europe & Central Asia (IDA & IBRD countries)European UnionFaroe IslandsFijiFinlandFragile and conflict affected situationsFranceFrench PolynesiaGabonGambia, TheGeorgiaGermanyGhanaGibraltarGreeceGreenlandGrenadaGuamGuatemalaGuineaGuinea-BissauGuyanaHaitiHeavily indebted poor countries (HIPC)High incomeHondurasHong Kong SAR, ChinaHungaryIBRD onlyIcelandIDA & IBRD totalIDA blendIDA onlyIDA totalIndiaIndonesiaIran, Islamic Rep.IraqIrelandIsraelItalyJamaicaJapanJordanKazakhstanKenyaKiribatiKorea, Dem. People’s Rep.Korea, Rep.KosovoKuwaitKyrgyz RepublicLao PDRLate-demographic dividendLatin America & Caribbean Latin America & Caribbean (excluding high income)Latin America & the Caribbean (IDA & IBRD countries)LatviaLeast developed countries: UN classificationLebanonLiberiaLibyaLithuaniaLow & middle incomeLow incomeLower middle incomeLuxembourgMacao SAR, ChinaMacedonia, FYRMadagascarMalawiMalaysiaMaldivesMaliMaltaMauritaniaMauritiusMexicoMiddle East & North AfricaMiddle East & North Africa (excluding high income)Middle East & North Africa (IDA & IBRD countries)Middle incomeMoldovaMongoliaMontenegroMoroccoMozambiqueMyanmarNauruNepalNetherlandsNew CaledoniaNew ZealandNicaraguaNigerNigeriaNorth AmericaNorwayOECD membersOmanOther small statesPacific island small statesPakistanPanamaPapua New GuineaParaguayPeruPhilippinesPolandPortugalPost-demographic dividendPre-demographic dividendQatarRomaniaRussian FederationRwandaSamoaSao Tome and PrincipeSaudi ArabiaSenegalSerbiaSeychellesSierra LeoneSingaporeSlovak RepublicSloveniaSmall statesSolomon IslandsSomaliaSouth AfricaSouth AsiaSouth Asia (IDA & IBRD)SpainSri LankaSt. Kitts and NevisSt. LuciaSt. Vincent and the GrenadinesSub-Saharan Africa Sub-Saharan Africa (excluding high income)Sub-Saharan Africa (IDA & IBRD countries)SudanSurinameSwedenSwitzerlandSyrian Arab RepublicTajikistanTanzaniaThailandTogoTongaTrinidad and TobagoTunisiaTurkeyTurkmenistanTuvaluUgandaUkraineUnited Arab EmiratesUnited KingdomUnited StatesUpper middle incomeUruguayUzbekistanVanuatuVenezuela, RBVietnamWorldYemen, Rep.ZambiaZimbabwe línea de tiempo (timeline):
En esta escala de tiempo se presenta un gráfico de 1965 y 2015 de Greenland. Los datos de 1964 están ausentes. El número de observaciones reales por fecha: 51.
Fuente (nombre):
Indicadores del desarrollo mundial
Fuente (organización):
World Bank staff estimates based data from International Monetary Fund's Direction of Trade database.
Categorías:
Private Sector, Trade
Se ha actualizado:
23 abr 2017 año
Los indicadores de los cambios de valor en los últimos años
Máximo:
10.066
1 ene 1985 año
A la fecha de observación
Valor
Cambio absoluto
El cambio con respecto al valor anterior
1 ene 1965 año
0.0
0.0
0.0%
1 ene 1973 año
0.48
+0.48
%
1 ene 1974 año
0.0
-0.48
-100.0%
1 ene 1975 año
0.958
+0.958
%
1 ene 1976 año
3.224
+2.266
236.53%
1 ene 1977 año
1.304
-1.92
-59.55%
1 ene 1978 año
0.0
-1.304
-100.0%
1 ene 1979 año
0.98
+0.98
%
1 ene 1980 año
6.211
+5.231
533.53%
1 ene 1981 año
3.703
-2.508
-40.38%
1 ene 1982 año
1.112
-2.591
-69.97%
1 ene 1983 año
2.258
+1.146
103.02%
1 ene 1984 año
1.497
-0.761
-33.7%
1 ene 1985 año
10.066
+8.569
572.36%
1 ene 1986 año
5.843
-4.223
-41.95%
1 ene 1987 año
2.004
-3.839
-65.7%
1 ene 1988 año
2.155
+0.151
7.53%
1 ene 1989 año
3.456
+1.301
60.35%
1 ene 1990 año
2.348
-1.109
-32.08%
1 ene 1991 año
1.468
-0.879
-37.46%
1 ene 1992 año
1.617
+0.149
10.13%
1 ene 1993 año
1.733
+0.116
7.17%
1 ene 1994 año
2.21
+0.477
27.51%
1 ene 1995 año
1.593
-0.617
-27.92%
1 ene 1996 año
0.793
-0.799
-50.19%
1 ene 1997 año
2.124
+1.331
167.75%
1 ene 1998 año
1.063
-1.061
-49.95%
1 ene 1999 año
1.75
+0.687
64.64%
1 ene 2000 año
1.275
-0.475
-27.16%
1 ene 2001 año
1.644
+0.369
28.93%
1 ene 2002 año
1.632
-0.011
-0.69%
1 ene 2003 año
1.671
+0.039
2.4%
1 ene 2004 año
1.823
+0.151
9.05%
1 ene 2005 año
2.237
+0.414
22.74%
1 ene 2006 año
2.376
+0.139
6.2%
1 ene 2007 año
3.123
+0.747
31.45%
1 ene 2008 año
3.194
+0.071
2.28%
1 ene 2009 año
3.195
+0.001
0.03%
1 ene 2010 año
3.21
+0.015
0.45%
1 ene 2011 año
4.215
+1.005
31.31%
1 ene 2012 año
3.986
-0.229
-5.43%
1 ene 2013 año
4.274
+0.288
7.23%
1 ene 2014 año
4.162
-0.112
-2.61%
1 ene 2015 año
4.446
+0.284
6.82%
Ranking de los países por los datos estadísticos actuales


Comentarios: