29
/es/
es
AIzaSyAYiBZKx7MnpbEhh9jyipgxe19OcubqV5w
April 1, 2024
134948
French Polynesia
PYF
true
2
1
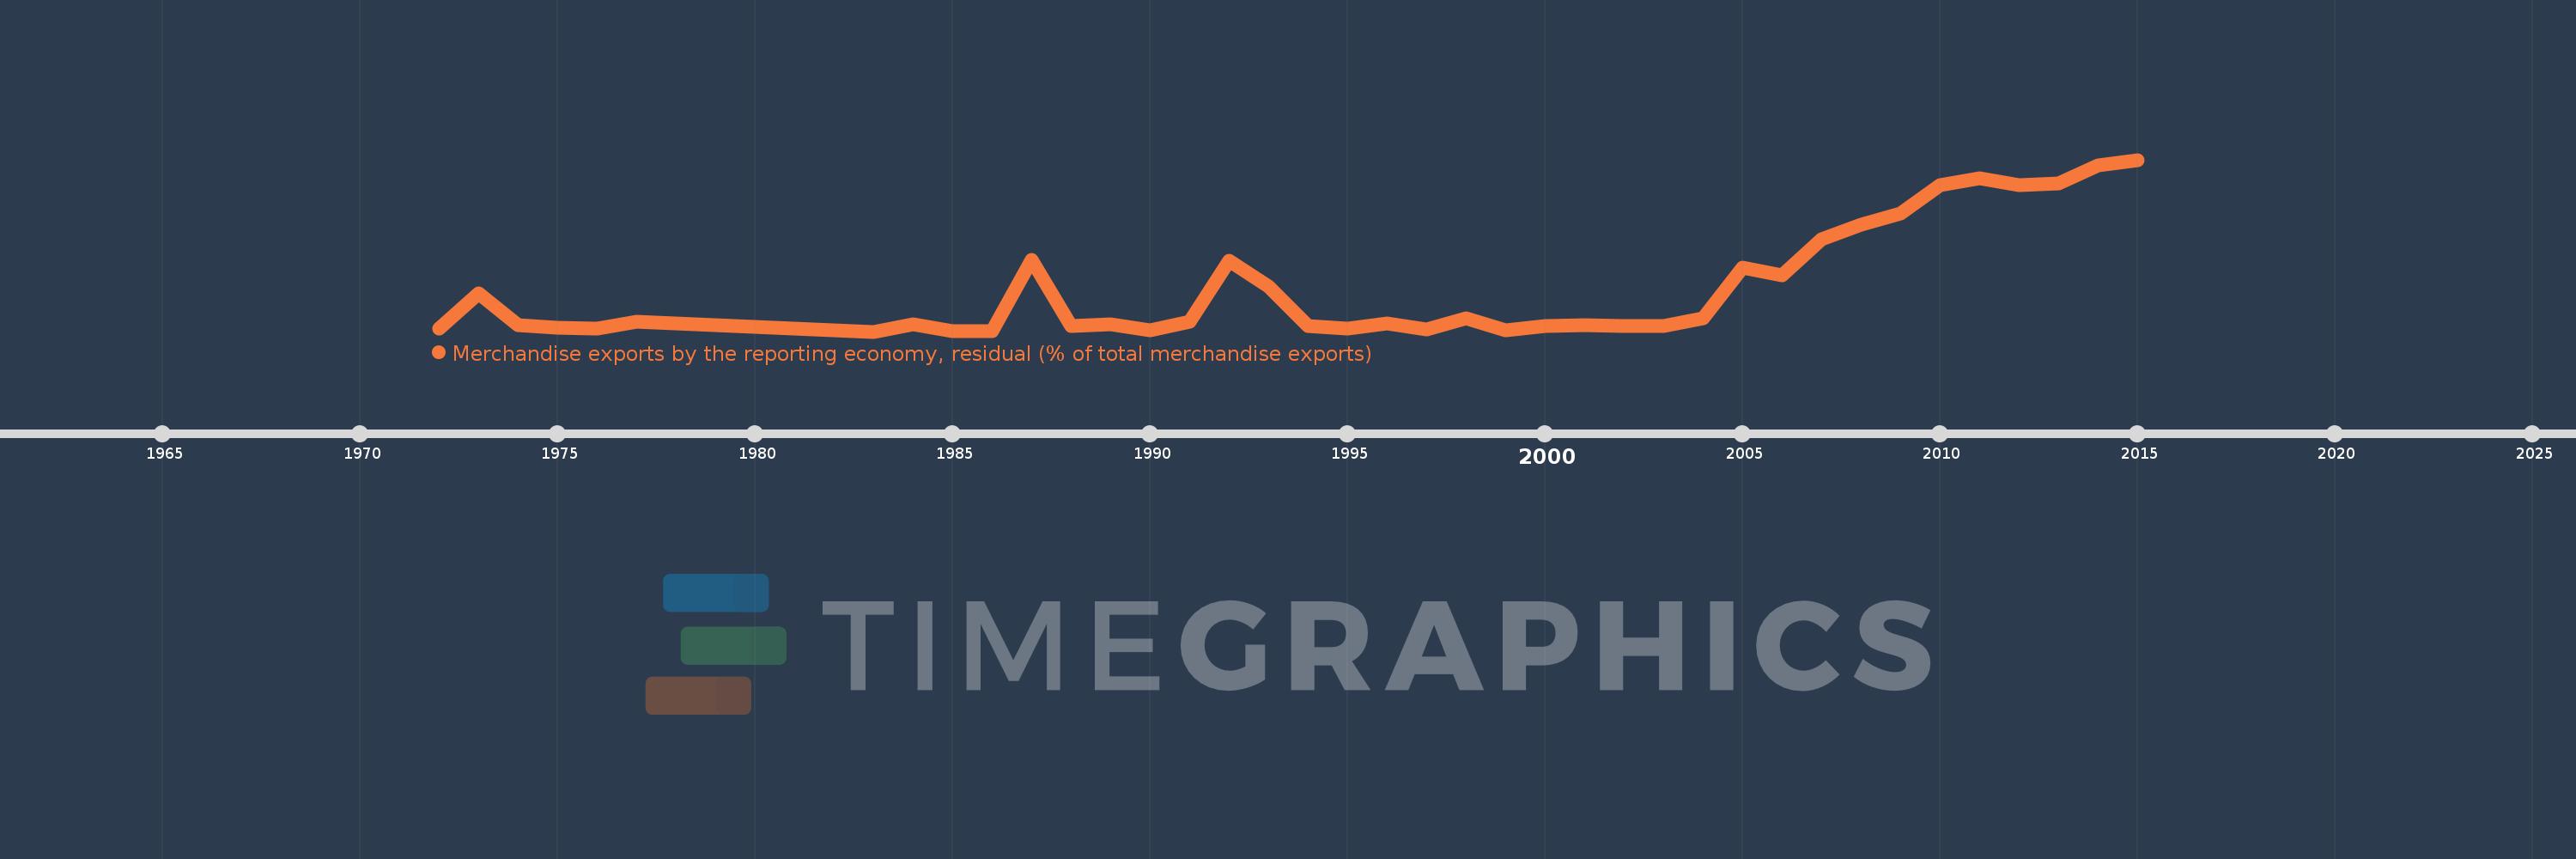
Merchandise exports by the reporting economy, residual (% of total merchandise exports)
2015,2014,2013,2012,2011,2010,2009,2008,2007,2006,2005,2004,2003,2002,2001,2000,1999,1998,1997,1996,1995,1994,1993,1992,1991,1990,1989,1988,1987,1986,1985,1984,1983,1982,1977,1976,1975,1974,1973,1972
Estas estadísticas en otros países:
AfghanistanAlbaniaAlgeriaAmerican SamoaAngolaAntigua and BarbudaArab WorldArgentinaArmeniaArubaAustraliaAustriaAzerbaijanBahamas, TheBahrainBangladeshBarbadosBelarusBelgiumBelizeBeninBermudaBoliviaBosnia and HerzegovinaBrazilBrunei DarussalamBulgariaBurkina FasoBurundiCabo VerdeCambodiaCameroonCanadaCaribbean small statesCentral African RepublicCentral Europe and the BalticsChadChileChinaColombiaComorosCongo, Dem. Rep.Congo, Rep.Costa RicaCote d'IvoireCroatiaCubaCyprusCzech RepublicDenmarkDjiboutiDominicaDominican RepublicEarly-demographic dividendEast Asia & PacificEast Asia & Pacific (excluding high income)East Asia & Pacific (IDA & IBRD countries)EcuadorEgypt, Arab Rep.El SalvadorEquatorial GuineaEstoniaEthiopiaEuro areaEurope & Central AsiaEurope & Central Asia (excluding high income)Europe & Central Asia (IDA & IBRD countries)European UnionFaroe IslandsFijiFinlandFragile and conflict affected situationsFranceFrench PolynesiaGabonGambia, TheGeorgiaGermanyGhanaGibraltarGreeceGreenlandGrenadaGuamGuatemalaGuineaGuinea-BissauGuyanaHaitiHeavily indebted poor countries (HIPC)High incomeHondurasHong Kong SAR, ChinaHungaryIBRD onlyIcelandIDA & IBRD totalIDA blendIDA onlyIDA totalIndiaIndonesiaIran, Islamic Rep.IraqIrelandIsraelItalyJamaicaJapanJordanKazakhstanKenyaKiribatiKorea, Dem. People’s Rep.Korea, Rep.KosovoKuwaitKyrgyz RepublicLao PDRLate-demographic dividendLatin America & Caribbean Latin America & Caribbean (excluding high income)Latin America & the Caribbean (IDA & IBRD countries)LatviaLeast developed countries: UN classificationLebanonLiberiaLibyaLithuaniaLow & middle incomeLow incomeLower middle incomeLuxembourgMacao SAR, ChinaMacedonia, FYRMadagascarMalawiMalaysiaMaldivesMaliMaltaMauritaniaMauritiusMexicoMiddle East & North AfricaMiddle East & North Africa (excluding high income)Middle East & North Africa (IDA & IBRD countries)Middle incomeMoldovaMongoliaMontenegroMoroccoMozambiqueMyanmarNauruNepalNetherlandsNew CaledoniaNew ZealandNicaraguaNigerNigeriaNorth AmericaNorwayOECD membersOmanOther small statesPacific island small statesPakistanPanamaPapua New GuineaParaguayPeruPhilippinesPolandPortugalPost-demographic dividendPre-demographic dividendQatarRomaniaRussian FederationRwandaSamoaSao Tome and PrincipeSaudi ArabiaSenegalSerbiaSeychellesSierra LeoneSingaporeSlovak RepublicSloveniaSmall statesSolomon IslandsSomaliaSouth AfricaSouth AsiaSouth Asia (IDA & IBRD)SpainSri LankaSt. Kitts and NevisSt. LuciaSt. Vincent and the GrenadinesSub-Saharan Africa Sub-Saharan Africa (excluding high income)Sub-Saharan Africa (IDA & IBRD countries)SudanSurinameSwedenSwitzerlandSyrian Arab RepublicTajikistanTanzaniaThailandTogoTongaTrinidad and TobagoTunisiaTurkeyTurkmenistanTuvaluUgandaUkraineUnited Arab EmiratesUnited KingdomUnited StatesUpper middle incomeUruguayUzbekistanVanuatuVenezuela, RBVietnamWorldYemen, Rep.ZambiaZimbabwe línea de tiempo (timeline):
En esta escala de tiempo se presenta un gráfico de 1972 y 2015 de French Polynesia. Los datos de 1971 están ausentes. El número de observaciones reales por fecha: 40.
Fuente (nombre):
Indicadores del desarrollo mundial
Fuente (organización):
World Bank staff estimates based data from International Monetary Fund's Direction of Trade database.
Categorías:
Private Sector, Trade
Se ha actualizado:
23 abr 2017 año
Los indicadores de los cambios de valor en los últimos años
Mínimo:
0.419
1 ene 1983 año
Máximo:
47.406
1 ene 2015 año
A la fecha de observación
Valor
Cambio absoluto
El cambio con respecto al valor anterior
1 ene 1972 año
1.156
+1.156
0.0%
1 ene 1973 año
10.959
+9.803
847.95%
1 ene 1974 año
2.151
-8.808
-80.38%
1 ene 1975 año
1.567
-0.583
-27.12%
1 ene 1976 año
1.181
-0.386
-24.65%
1 ene 1977 año
3.196
+2.015
170.62%
1 ene 1982 año
0.704
-2.493
-77.98%
1 ene 1983 año
0.419
-0.285
-40.54%
1 ene 1984 año
2.306
+1.887
450.91%
1 ene 1985 año
0.463
-1.843
-79.93%
1 ene 1986 año
0.551
+0.089
19.17%
1 ene 1987 año
20.127
+19.576
3.55 mil%
1 ene 1988 año
2.011
-18.116
-90.01%
1 ene 1989 año
2.339
+0.327
16.27%
1 ene 1990 año
0.74
-1.599
-68.38%
1 ene 1991 año
3.231
+2.491
336.88%
1 ene 1992 año
19.902
+16.671
515.98%
1 ene 1993 año
12.661
-7.242
-36.39%
1 ene 1994 año
1.936
-10.724
-84.71%
1 ene 1995 año
1.129
-0.807
-41.7%
1 ene 1996 año
2.689
+1.56
138.19%
1 ene 1997 año
0.979
-1.71
-63.6%
1 ene 1998 año
4.104
+3.126
319.38%
1 ene 1999 año
0.82
-3.285
-80.03%
1 ene 2000 año
1.934
+1.114
135.92%
1 ene 2001 año
2.079
+0.145
7.48%
1 ene 2002 año
2.001
-0.078
-3.76%
1 ene 2003 año
2.009
+0.009
0.44%
1 ene 2004 año
4.025
+2.015
100.3%
1 ene 2005 año
17.969
+13.945
346.48%
1 ene 2006 año
15.743
-2.226
-12.39%
1 ene 2007 año
25.72
+9.977
63.38%
1 ene 2008 año
29.56
+3.84
14.93%
1 ene 2009 año
32.705
+3.145
10.64%
1 ene 2010 año
40.488
+7.783
23.8%
1 ene 2011 año
42.337
+1.85
4.57%
1 ene 2012 año
40.54
-1.797
-4.24%
1 ene 2013 año
41.045
+0.505
1.25%
1 ene 2014 año
45.919
+4.874
11.87%
1 ene 2015 año
47.406
+1.487
3.24%
Ranking de los países por los datos estadísticos actuales


Comentarios: