29
/es/
es
AIzaSyAYiBZKx7MnpbEhh9jyipgxe19OcubqV5w
April 1, 2024
244742
Somalia
SOM
true
2
1
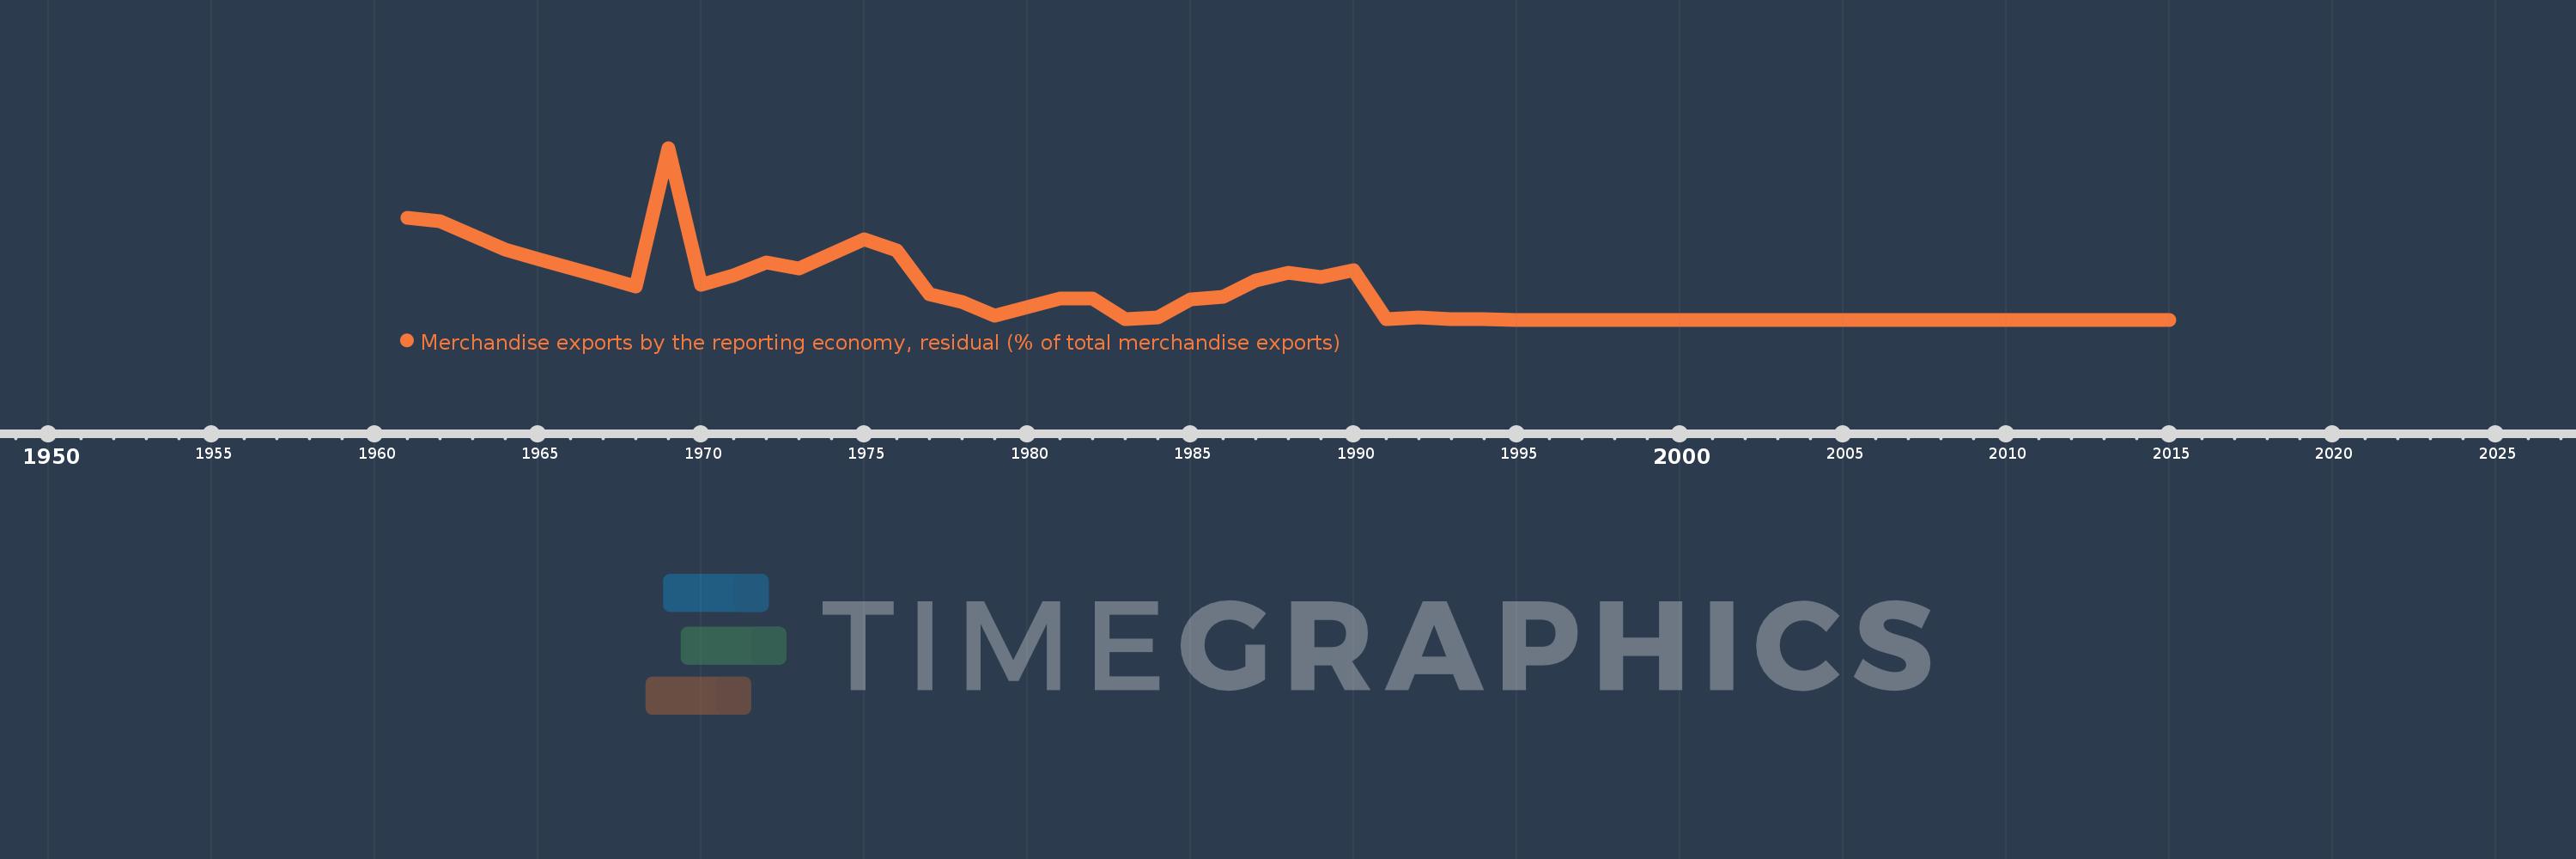
Merchandise exports by the reporting economy, residual (% of total merchandise exports)
2015,2014,2013,2012,2011,2010,2009,2008,2007,2006,2005,2004,2003,2002,2001,2000,1999,1998,1997,1996,1995,1994,1993,1992,1991,1990,1989,1988,1987,1986,1985,1984,1983,1982,1981,1979,1978,1977,1976,1975,1974,1973,1972,1971,1970,1969,1968,1967,1965,1964,1962,1961
Estas estadísticas en otros países:
AfghanistanAlbaniaAlgeriaAmerican SamoaAngolaAntigua and BarbudaArab WorldArgentinaArmeniaArubaAustraliaAustriaAzerbaijanBahamas, TheBahrainBangladeshBarbadosBelarusBelgiumBelizeBeninBermudaBoliviaBosnia and HerzegovinaBrazilBrunei DarussalamBulgariaBurkina FasoBurundiCabo VerdeCambodiaCameroonCanadaCaribbean small statesCentral African RepublicCentral Europe and the BalticsChadChileChinaColombiaComorosCongo, Dem. Rep.Congo, Rep.Costa RicaCote d'IvoireCroatiaCubaCyprusCzech RepublicDenmarkDjiboutiDominicaDominican RepublicEarly-demographic dividendEast Asia & PacificEast Asia & Pacific (excluding high income)East Asia & Pacific (IDA & IBRD countries)EcuadorEgypt, Arab Rep.El SalvadorEquatorial GuineaEstoniaEthiopiaEuro areaEurope & Central AsiaEurope & Central Asia (excluding high income)Europe & Central Asia (IDA & IBRD countries)European UnionFaroe IslandsFijiFinlandFragile and conflict affected situationsFranceFrench PolynesiaGabonGambia, TheGeorgiaGermanyGhanaGibraltarGreeceGreenlandGrenadaGuamGuatemalaGuineaGuinea-BissauGuyanaHaitiHeavily indebted poor countries (HIPC)High incomeHondurasHong Kong SAR, ChinaHungaryIBRD onlyIcelandIDA & IBRD totalIDA blendIDA onlyIDA totalIndiaIndonesiaIran, Islamic Rep.IraqIrelandIsraelItalyJamaicaJapanJordanKazakhstanKenyaKiribatiKorea, Dem. People’s Rep.Korea, Rep.KosovoKuwaitKyrgyz RepublicLao PDRLate-demographic dividendLatin America & Caribbean Latin America & Caribbean (excluding high income)Latin America & the Caribbean (IDA & IBRD countries)LatviaLeast developed countries: UN classificationLebanonLiberiaLibyaLithuaniaLow & middle incomeLow incomeLower middle incomeLuxembourgMacao SAR, ChinaMacedonia, FYRMadagascarMalawiMalaysiaMaldivesMaliMaltaMauritaniaMauritiusMexicoMiddle East & North AfricaMiddle East & North Africa (excluding high income)Middle East & North Africa (IDA & IBRD countries)Middle incomeMoldovaMongoliaMontenegroMoroccoMozambiqueMyanmarNauruNepalNetherlandsNew CaledoniaNew ZealandNicaraguaNigerNigeriaNorth AmericaNorwayOECD membersOmanOther small statesPacific island small statesPakistanPanamaPapua New GuineaParaguayPeruPhilippinesPolandPortugalPost-demographic dividendPre-demographic dividendQatarRomaniaRussian FederationRwandaSamoaSao Tome and PrincipeSaudi ArabiaSenegalSerbiaSeychellesSierra LeoneSingaporeSlovak RepublicSloveniaSmall statesSolomon IslandsSomaliaSouth AfricaSouth AsiaSouth Asia (IDA & IBRD)SpainSri LankaSt. Kitts and NevisSt. LuciaSt. Vincent and the GrenadinesSub-Saharan Africa Sub-Saharan Africa (excluding high income)Sub-Saharan Africa (IDA & IBRD countries)SudanSurinameSwedenSwitzerlandSyrian Arab RepublicTajikistanTanzaniaThailandTogoTongaTrinidad and TobagoTunisiaTurkeyTurkmenistanTuvaluUgandaUkraineUnited Arab EmiratesUnited KingdomUnited StatesUpper middle incomeUruguayUzbekistanVanuatuVenezuela, RBVietnamWorldYemen, Rep.ZambiaZimbabwe línea de tiempo (timeline):
En esta escala de tiempo se presenta un gráfico de 1961 y 2015 de Somalia. Los datos de 1960 están ausentes. El número de observaciones reales por fecha: 52.
Fuente (nombre):
Indicadores del desarrollo mundial
Fuente (organización):
World Bank staff estimates based data from International Monetary Fund's Direction of Trade database.
Categorías:
Private Sector, Trade
Se ha actualizado:
23 abr 2017 año
Los indicadores de los cambios de valor en los últimos años
Mínimo:
0.009
1 ene 1995 año
Máximo:
67.365
1 ene 1969 año
A la fecha de observación
Valor
Cambio absoluto
El cambio con respecto al valor anterior
1 ene 1961 año
40.0
+40.0
0.0%
1 ene 1962 año
38.783
-1.217
-3.04%
1 ene 1964 año
27.5
-11.283
-29.09%
1 ene 1965 año
23.955
-3.545
-12.89%
1 ene 1967 año
16.717
-7.238
-30.21%
1 ene 1968 año
13.089
-3.628
-21.7%
1 ene 1969 año
67.365
+54.276
414.67%
1 ene 1970 año
13.85
-53.515
-79.44%
1 ene 1971 año
17.269
+3.419
24.69%
1 ene 1972 año
22.393
+5.124
29.67%
1 ene 1973 año
20.011
-2.382
-10.64%
1 ene 1974 año
25.774
+5.763
28.8%
1 ene 1975 año
31.645
+5.872
22.78%
1 ene 1976 año
27.091
-4.554
-14.39%
1 ene 1977 año
9.877
-17.214
-63.54%
1 ene 1978 año
6.856
-3.021
-30.58%
1 ene 1979 año
1.557
-5.299
-77.29%
1 ene 1981 año
8.309
+6.752
433.7%
1 ene 1982 año
8.309
0.0
0.0%
1 ene 1983 año
0.361
-7.948
-95.65%
1 ene 1984 año
0.767
+0.406
112.36%
1 ene 1985 año
7.924
+7.157
932.87%
1 ene 1986 año
8.947
+1.023
12.91%
1 ene 1987 año
15.309
+6.362
71.11%
1 ene 1988 año
18.315
+3.006
19.64%
1 ene 1989 año
16.753
-1.562
-8.53%
1 ene 1990 año
19.345
+2.593
15.48%
1 ene 1991 año
0.206
-19.139
-98.93%
1 ene 1992 año
0.879
+0.673
326.45%
1 ene 1993 año
0.132
-0.748
-85.02%
1 ene 1994 año
0.131
-0.001
-0.87%
1 ene 1995 año
0.009
-0.121
-92.94%
1 ene 1996 año
0.013
+0.004
43.82%
1 ene 1997 año
0.009
-0.004
-29.59%
1 ene 1998 año
0.013
+0.003
34.38%
1 ene 1999 año
0.018
+0.005
41.5%
1 ene 2000 año
0.022
+0.004
22.33%
1 ene 2001 año
0.025
+0.003
13.73%
1 ene 2002 año
0.04
+0.016
63.36%
1 ene 2003 año
0.032
-0.009
-21.36%
1 ene 2004 año
0.03
-0.002
-5.7%
1 ene 2005 año
0.031
+0.001
4.33%
1 ene 2006 año
0.027
-0.004
-12.5%
1 ene 2007 año
0.028
+0.001
3.25%
1 ene 2008 año
0.029
+0.0
1.39%
1 ene 2009 año
0.026
-0.002
-7.67%
1 ene 2010 año
0.022
-0.004
-14.92%
1 ene 2011 año
0.024
+0.002
8.62%
1 ene 2012 año
0.024
0.0
-1.93%
1 ene 2013 año
0.022
-0.001
-6.17%
1 ene 2014 año
0.02
-0.003
-11.97%
1 ene 2015 año
0.021
+0.001
4.0%
Ranking de los países por los datos estadísticos actuales


Comentarios: