30
/es/
AIzaSyAYiBZKx7MnpbEhh9jyipgxe19OcubqV5w
April 1, 2024
66076
Algeria
DZA
true
2
1
Gross savings (% of GDP)
2015,2014,2013,2012,2011,2010,2009,2008,2007,2006,1992,1991,1990,1989,1988,1987,1986,1985,1984,1983,1982,1981,1980,1979,1978
Download
Estadísticas Globales de la Biblioteca →Algeria →

Gross savings (% of GDP)

Estas estadísticas en otros países:

AfghanistanAlbaniaAlgeriaAngolaAntigua and BarbudaArab WorldArgentinaArmeniaAustraliaAustriaAzerbaijanBahamas, TheBahrainBangladeshBarbadosBelarusBelgiumBelizeBeninBermudaBhutanBoliviaBosnia and HerzegovinaBotswanaBrazilBrunei DarussalamBulgariaBurkina FasoBurundiCabo VerdeCambodiaCameroonCanadaCaribbean small statesCentral African RepublicCentral Europe and the BalticsChadChileChinaColombiaComorosCongo, Dem. Rep.Congo, Rep.Costa RicaCote d'IvoireCroatiaCyprusCzech RepublicDenmarkDjiboutiDominicaDominican RepublicEarly-demographic dividendEast Asia & PacificEast Asia & Pacific (excluding high income)East Asia & Pacific (IDA & IBRD countries)EcuadorEgypt, Arab Rep.El SalvadorEquatorial GuineaEritreaEstoniaEthiopiaEuro areaEurope & Central AsiaEurope & Central Asia (excluding high income)Europe & Central Asia (IDA & IBRD countries)European UnionFaroe IslandsFijiFinlandFragile and conflict affected situationsFranceGabonGambia, TheGeorgiaGermanyGhanaGreeceGrenadaGuatemalaGuineaGuinea-BissauGuyanaHaitiHeavily indebted poor countries (HIPC)High incomeHondurasHong Kong SAR, ChinaHungaryIBRD onlyIcelandIDA & IBRD totalIDA blendIDA onlyIDA totalIndiaIndonesiaIran, Islamic Rep.IraqIrelandIsraelItalyJamaicaJapanJordanKazakhstanKenyaKiribatiKorea, Rep.KosovoKuwaitKyrgyz RepublicLao PDRLate-demographic dividendLatin America & Caribbean Latin America & Caribbean (excluding high income)Latin America & the Caribbean (IDA & IBRD countries)LatviaLeast developed countries: UN classificationLebanonLesothoLiberiaLibyaLithuaniaLow & middle incomeLow incomeLower middle incomeLuxembourgMacao SAR, ChinaMacedonia, FYRMadagascarMalawiMalaysiaMaldivesMaliMaltaMauritaniaMauritiusMexicoMiddle East & North AfricaMiddle East & North Africa (excluding high income)Middle East & North Africa (IDA & IBRD countries)Middle incomeMoldovaMongoliaMontenegroMoroccoMozambiqueNamibiaNepalNetherlandsNew ZealandNicaraguaNigerNigeriaNorth AmericaNorwayOECD membersOmanOther small statesPacific island small statesPakistanPanamaPapua New GuineaParaguayPeruPhilippinesPolandPortugalPost-demographic dividendPre-demographic dividendQatarRomaniaRussian FederationRwandaSaudi ArabiaSenegalSerbiaSeychellesSierra LeoneSingaporeSlovak RepublicSloveniaSmall statesSolomon IslandsSouth AfricaSouth AsiaSouth Asia (IDA & IBRD)South SudanSpainSri LankaSt. Kitts and NevisSt. LuciaSt. Vincent and the GrenadinesSub-Saharan Africa Sub-Saharan Africa (excluding high income)Sub-Saharan Africa (IDA & IBRD countries)SudanSurinameSwazilandSwedenSwitzerlandSyrian Arab RepublicTajikistanTanzaniaThailandTimor-LesteTogoTongaTrinidad and TobagoTunisiaTurkeyUgandaUkraineUnited KingdomUnited StatesUpper middle incomeUruguayVanuatuVenezuela, RBVietnamWest Bank and GazaWorldYemen, Rep.ZambiaZimbabwe

línea de tiempo (timeline):

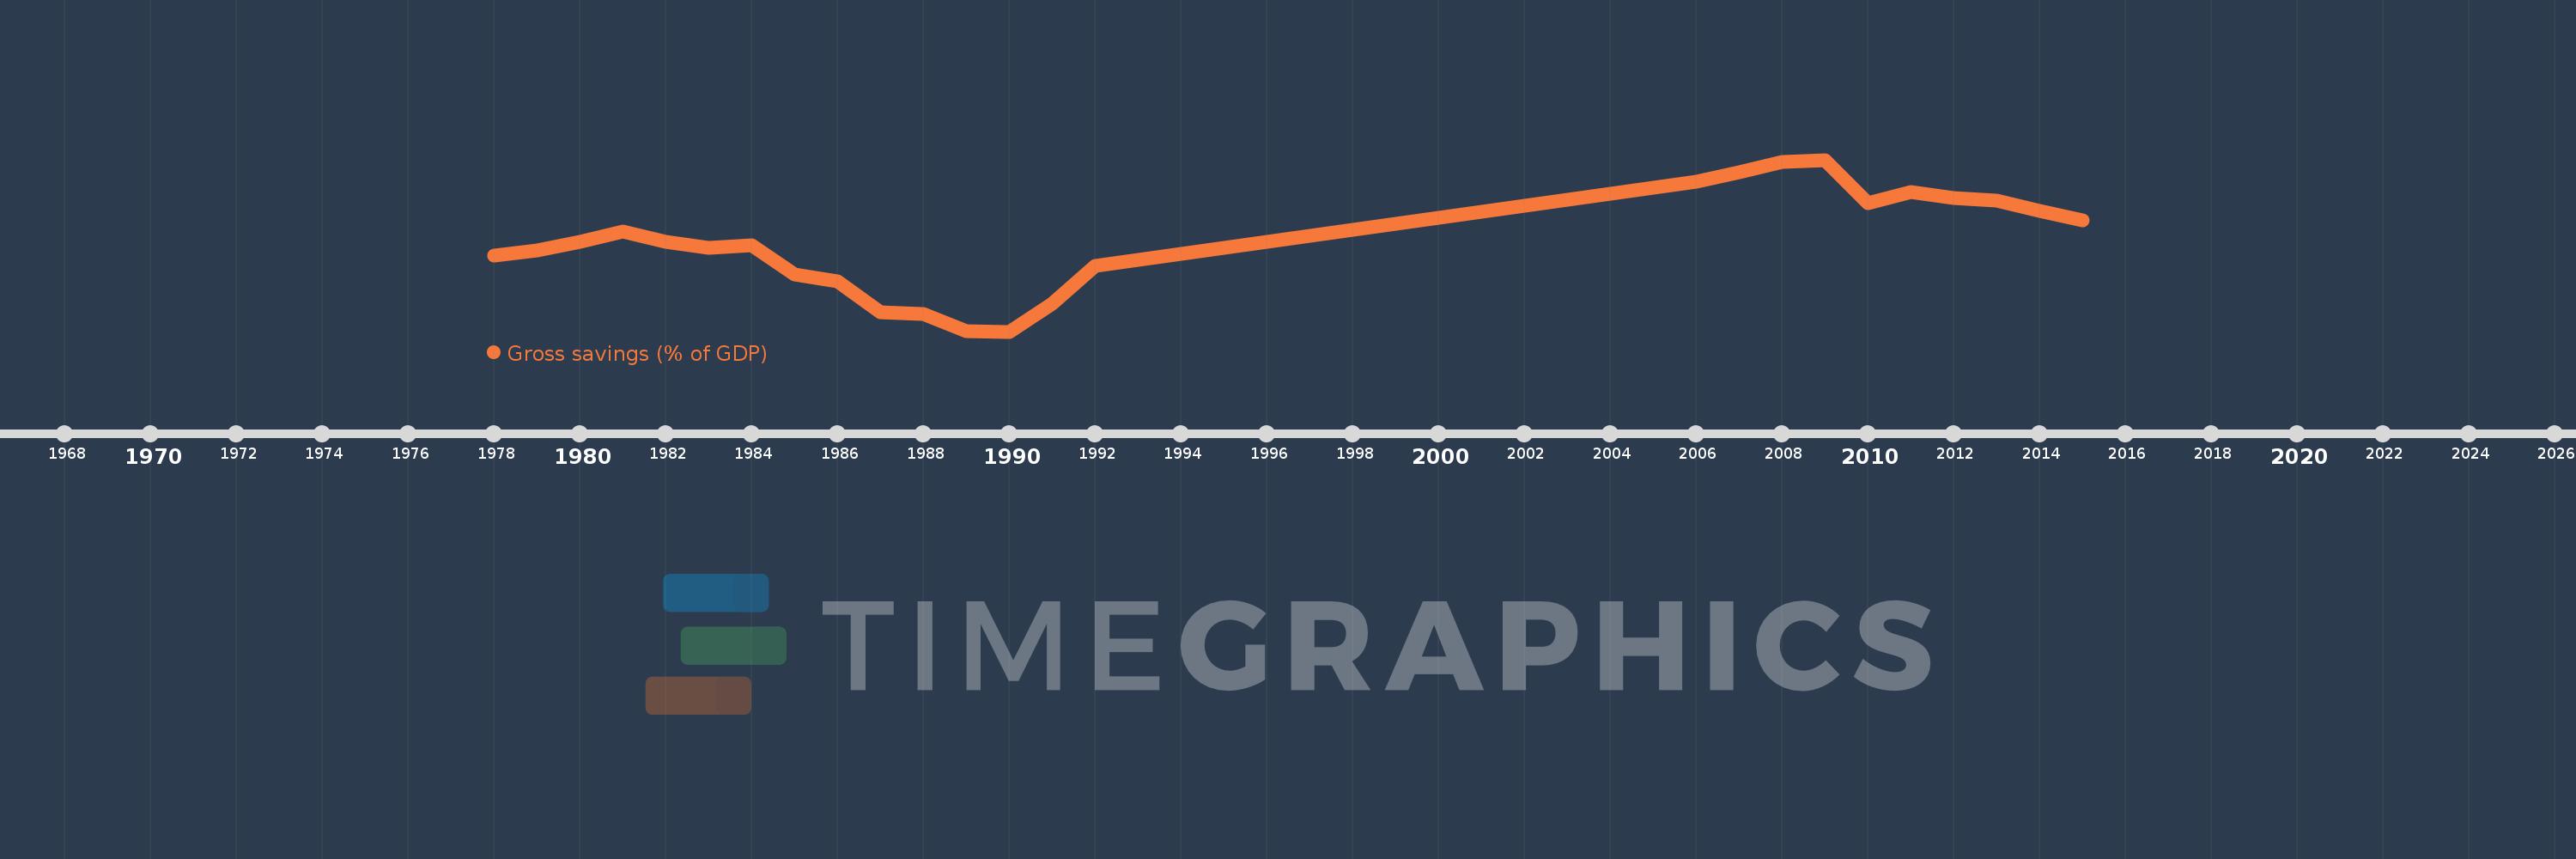
En esta escala de tiempo se presenta un gráfico de 1978 y 2015 de Algeria. Los datos de 1977 están ausentes. El número de observaciones reales por fecha: 25.

Fuente (nombre):

Indicadores del desarrollo mundial

Fuente (organización):

World Bank national accounts data, and OECD National Accounts data files.

Categorías:

Economy & Growth

Se ha actualizado:

23 abr 2017 año

Los indicadores de los cambios de valor en los últimos años

En promedio:
38.656
Mínimo:
17.773
1 ene 1990 año
Máximo:
57.438
1 ene 2009 año
A la fecha de observación
Valor
Cambio absoluto
El cambio con respecto al valor anterior
1 ene 1978 año
35.378
+35.378
0.0%
1 ene 1979 año
36.582
+1.204
3.4%
1 ene 1980 año
38.515
+1.933
5.28%
1 ene 1981 año
40.959
+2.444
6.34%
1 ene 1982 año
38.573
-2.386
-5.83%
1 ene 1983 año
37.034
-1.539
-3.99%
1 ene 1984 año
37.687
+0.653
1.76%
1 ene 1985 año
30.993
-6.694
-17.76%
1 ene 1986 año
29.353
-1.64
-5.29%
1 ene 1987 año
22.193
-7.16
-24.39%
1 ene 1988 año
21.899
-0.293
-1.32%
1 ene 1989 año
17.803
-4.096
-18.71%
1 ene 1990 año
17.773
-0.03
-0.17%
1 ene 1991 año
24.264
+6.491
36.52%
1 ene 1992 año
32.976
+8.712
35.9%
1 ene 2006 año
52.346
+19.37
58.74%
1 ene 2007 año
54.659
+2.313
4.42%
1 ene 2008 año
56.981
+2.321
4.25%
1 ene 2009 año
57.438
+0.457
0.8%
1 ene 2010 año
47.345
-10.093
-17.57%
1 ene 2011 año
49.975
+2.63
5.55%
1 ene 2012 año
48.605
-1.37
-2.74%
1 ene 2013 año
47.935
-0.67
-1.38%
1 ene 2014 año
45.657
-2.278
-4.75%
1 ene 2015 año
43.467
-2.19
-4.8%

Ranking de los países por los datos estadísticos actuales