29
/es/
es
AIzaSyAYiBZKx7MnpbEhh9jyipgxe19OcubqV5w
April 1, 2024
187863
Malaysia
MYS
true
2
1
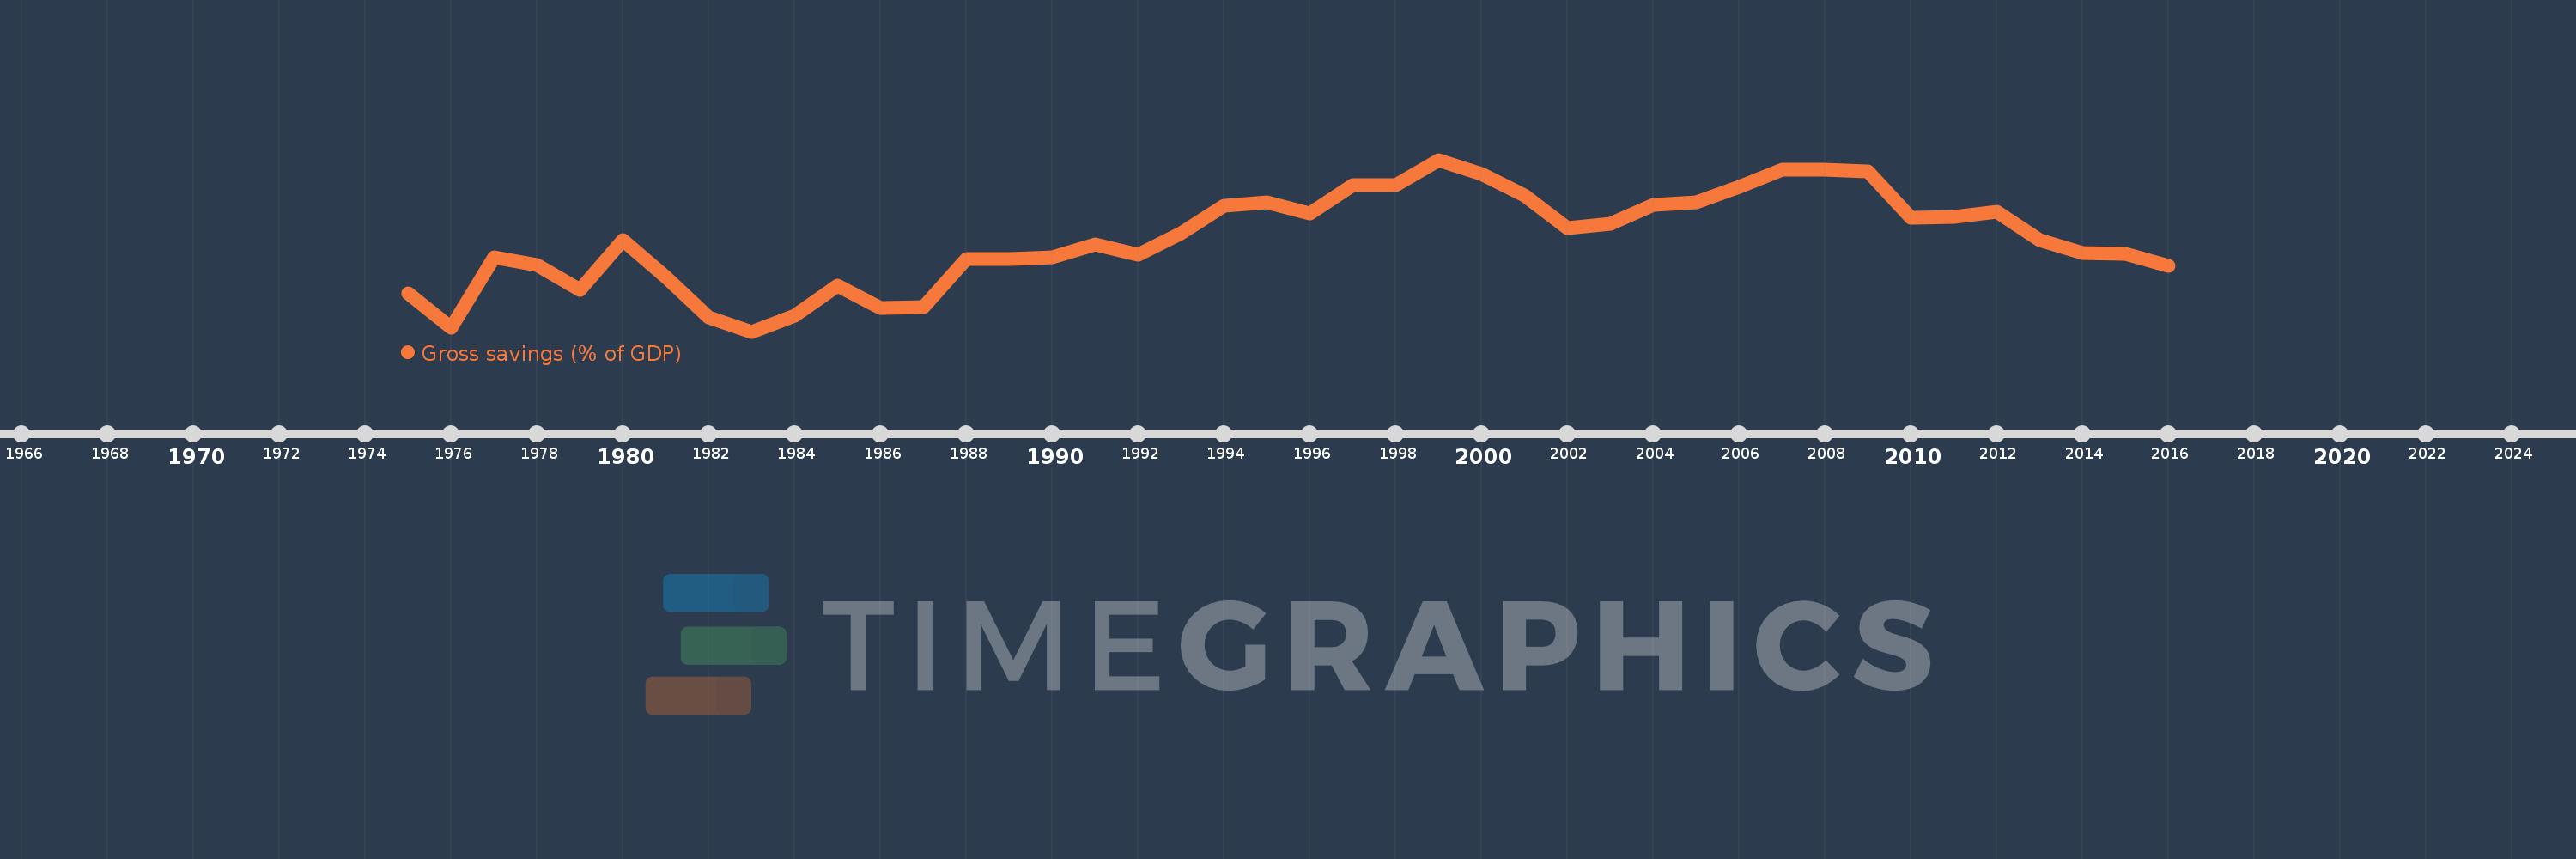
Gross savings (% of GDP)
2016,2015,2014,2013,2012,2011,2010,2009,2008,2007,2006,2005,2004,2003,2002,2001,2000,1999,1998,1997,1996,1995,1994,1993,1992,1991,1990,1989,1988,1987,1986,1985,1984,1983,1982,1981,1980,1979,1978,1977,1976,1975
Estas estadísticas en otros países:
AfghanistanAlbaniaAlgeriaAngolaAntigua and BarbudaArab WorldArgentinaArmeniaAustraliaAustriaAzerbaijanBahamas, TheBahrainBangladeshBarbadosBelarusBelgiumBelizeBeninBermudaBhutanBoliviaBosnia and HerzegovinaBotswanaBrazilBrunei DarussalamBulgariaBurkina FasoBurundiCabo VerdeCambodiaCameroonCanadaCaribbean small statesCentral African RepublicCentral Europe and the BalticsChadChileChinaColombiaComorosCongo, Dem. Rep.Congo, Rep.Costa RicaCote d'IvoireCroatiaCyprusCzech RepublicDenmarkDjiboutiDominicaDominican RepublicEarly-demographic dividendEast Asia & PacificEast Asia & Pacific (excluding high income)East Asia & Pacific (IDA & IBRD countries)EcuadorEgypt, Arab Rep.El SalvadorEquatorial GuineaEritreaEstoniaEthiopiaEuro areaEurope & Central AsiaEurope & Central Asia (excluding high income)Europe & Central Asia (IDA & IBRD countries)European UnionFaroe IslandsFijiFinlandFragile and conflict affected situationsFranceGabonGambia, TheGeorgiaGermanyGhanaGreeceGrenadaGuatemalaGuineaGuinea-BissauGuyanaHaitiHeavily indebted poor countries (HIPC)High incomeHondurasHong Kong SAR, ChinaHungaryIBRD onlyIcelandIDA & IBRD totalIDA blendIDA onlyIDA totalIndiaIndonesiaIran, Islamic Rep.IraqIrelandIsraelItalyJamaicaJapanJordanKazakhstanKenyaKiribatiKorea, Rep.KosovoKuwaitKyrgyz RepublicLao PDRLate-demographic dividendLatin America & Caribbean Latin America & Caribbean (excluding high income)Latin America & the Caribbean (IDA & IBRD countries)LatviaLeast developed countries: UN classificationLebanonLesothoLiberiaLibyaLithuaniaLow & middle incomeLow incomeLower middle incomeLuxembourgMacao SAR, ChinaMacedonia, FYRMadagascarMalawiMalaysiaMaldivesMaliMaltaMauritaniaMauritiusMexicoMiddle East & North AfricaMiddle East & North Africa (excluding high income)Middle East & North Africa (IDA & IBRD countries)Middle incomeMoldovaMongoliaMontenegroMoroccoMozambiqueNamibiaNepalNetherlandsNew ZealandNicaraguaNigerNigeriaNorth AmericaNorwayOECD membersOmanOther small statesPacific island small statesPakistanPanamaPapua New GuineaParaguayPeruPhilippinesPolandPortugalPost-demographic dividendPre-demographic dividendQatarRomaniaRussian FederationRwandaSaudi ArabiaSenegalSerbiaSeychellesSierra LeoneSingaporeSlovak RepublicSloveniaSmall statesSolomon IslandsSouth AfricaSouth AsiaSouth Asia (IDA & IBRD)South SudanSpainSri LankaSt. Kitts and NevisSt. LuciaSt. Vincent and the GrenadinesSub-Saharan Africa Sub-Saharan Africa (excluding high income)Sub-Saharan Africa (IDA & IBRD countries)SudanSurinameSwazilandSwedenSwitzerlandSyrian Arab RepublicTajikistanTanzaniaThailandTimor-LesteTogoTongaTrinidad and TobagoTunisiaTurkeyUgandaUkraineUnited KingdomUnited StatesUpper middle incomeUruguayVanuatuVenezuela, RBVietnamWest Bank and GazaWorldYemen, Rep.ZambiaZimbabwe línea de tiempo (timeline):
En esta escala de tiempo se presenta un gráfico de 1975 y 2016 de Malaysia. Los datos de 1974 están ausentes. El número de observaciones reales por fecha: 42.
Fuente (nombre):
Indicadores del desarrollo mundial
Fuente (organización):
World Bank national accounts data, and OECD National Accounts data files.
Categorías:
Economy & Growth
Se ha actualizado:
23 abr 2017 año
Los indicadores de los cambios de valor en los últimos años
Mínimo:
20.72
1 ene 1983 año
Máximo:
39.849
1 ene 1999 año
A la fecha de observación
Valor
Cambio absoluto
El cambio con respecto al valor anterior
1 ene 1975 año
25.024
+25.024
0.0%
1 ene 1976 año
21.185
-3.839
-15.34%
1 ene 1977 año
28.954
+7.769
36.67%
1 ene 1978 año
28.175
-0.78
-2.69%
1 ene 1979 año
25.358
-2.817
-10.0%
1 ene 1980 año
30.94
+5.582
22.01%
1 ene 1981 año
26.755
-4.185
-13.53%
1 ene 1982 año
22.272
-4.483
-16.76%
1 ene 1983 año
20.72
-1.552
-6.97%
1 ene 1984 año
22.468
+1.748
8.44%
1 ene 1985 año
25.827
+3.358
14.95%
1 ene 1986 año
23.311
-2.515
-9.74%
1 ene 1987 año
23.441
+0.129
0.55%
1 ene 1988 año
28.84
+5.399
23.03%
1 ene 1989 año
28.837
-0.003
-0.01%
1 ene 1990 año
28.957
+0.119
0.41%
1 ene 1991 año
30.384
+1.427
4.93%
1 ene 1992 año
29.278
-1.105
-3.64%
1 ene 1993 año
31.697
+2.419
8.26%
1 ene 1994 año
34.714
+3.017
9.52%
1 ene 1995 año
35.092
+0.378
1.09%
1 ene 1996 año
33.894
-1.198
-3.41%
1 ene 1997 año
37.042
+3.149
9.29%
1 ene 1998 año
37.021
-0.022
-0.06%
1 ene 1999 año
39.849
+2.828
7.64%
1 ene 2000 año
38.305
-1.544
-3.87%
1 ene 2001 año
35.917
-2.388
-6.23%
1 ene 2002 año
32.252
-3.665
-10.2%
1 ene 2003 año
32.735
+0.483
1.5%
1 ene 2004 año
34.852
+2.117
6.47%
1 ene 2005 año
35.137
+0.285
0.82%
1 ene 2006 año
36.816
+1.679
4.78%
1 ene 2007 año
38.796
+1.981
5.38%
1 ene 2008 año
38.767
-0.029
-0.08%
1 ene 2009 año
38.518
-0.249
-0.64%
1 ene 2010 año
33.357
-5.161
-13.4%
1 ene 2011 año
33.466
+0.109
0.33%
1 ene 2012 año
34.082
+0.615
1.84%
1 ene 2013 año
30.915
-3.167
-9.29%
1 ene 2014 año
29.449
-1.466
-4.74%
1 ene 2015 año
29.353
-0.097
-0.33%
1 ene 2016 año
28.033
-1.32
-4.5%
Ranking de los países por los datos estadísticos actuales


Comentarios: