29
/es/
es
AIzaSyAYiBZKx7MnpbEhh9jyipgxe19OcubqV5w
April 1, 2024
208012
Netherlands
NLD
true
2
1
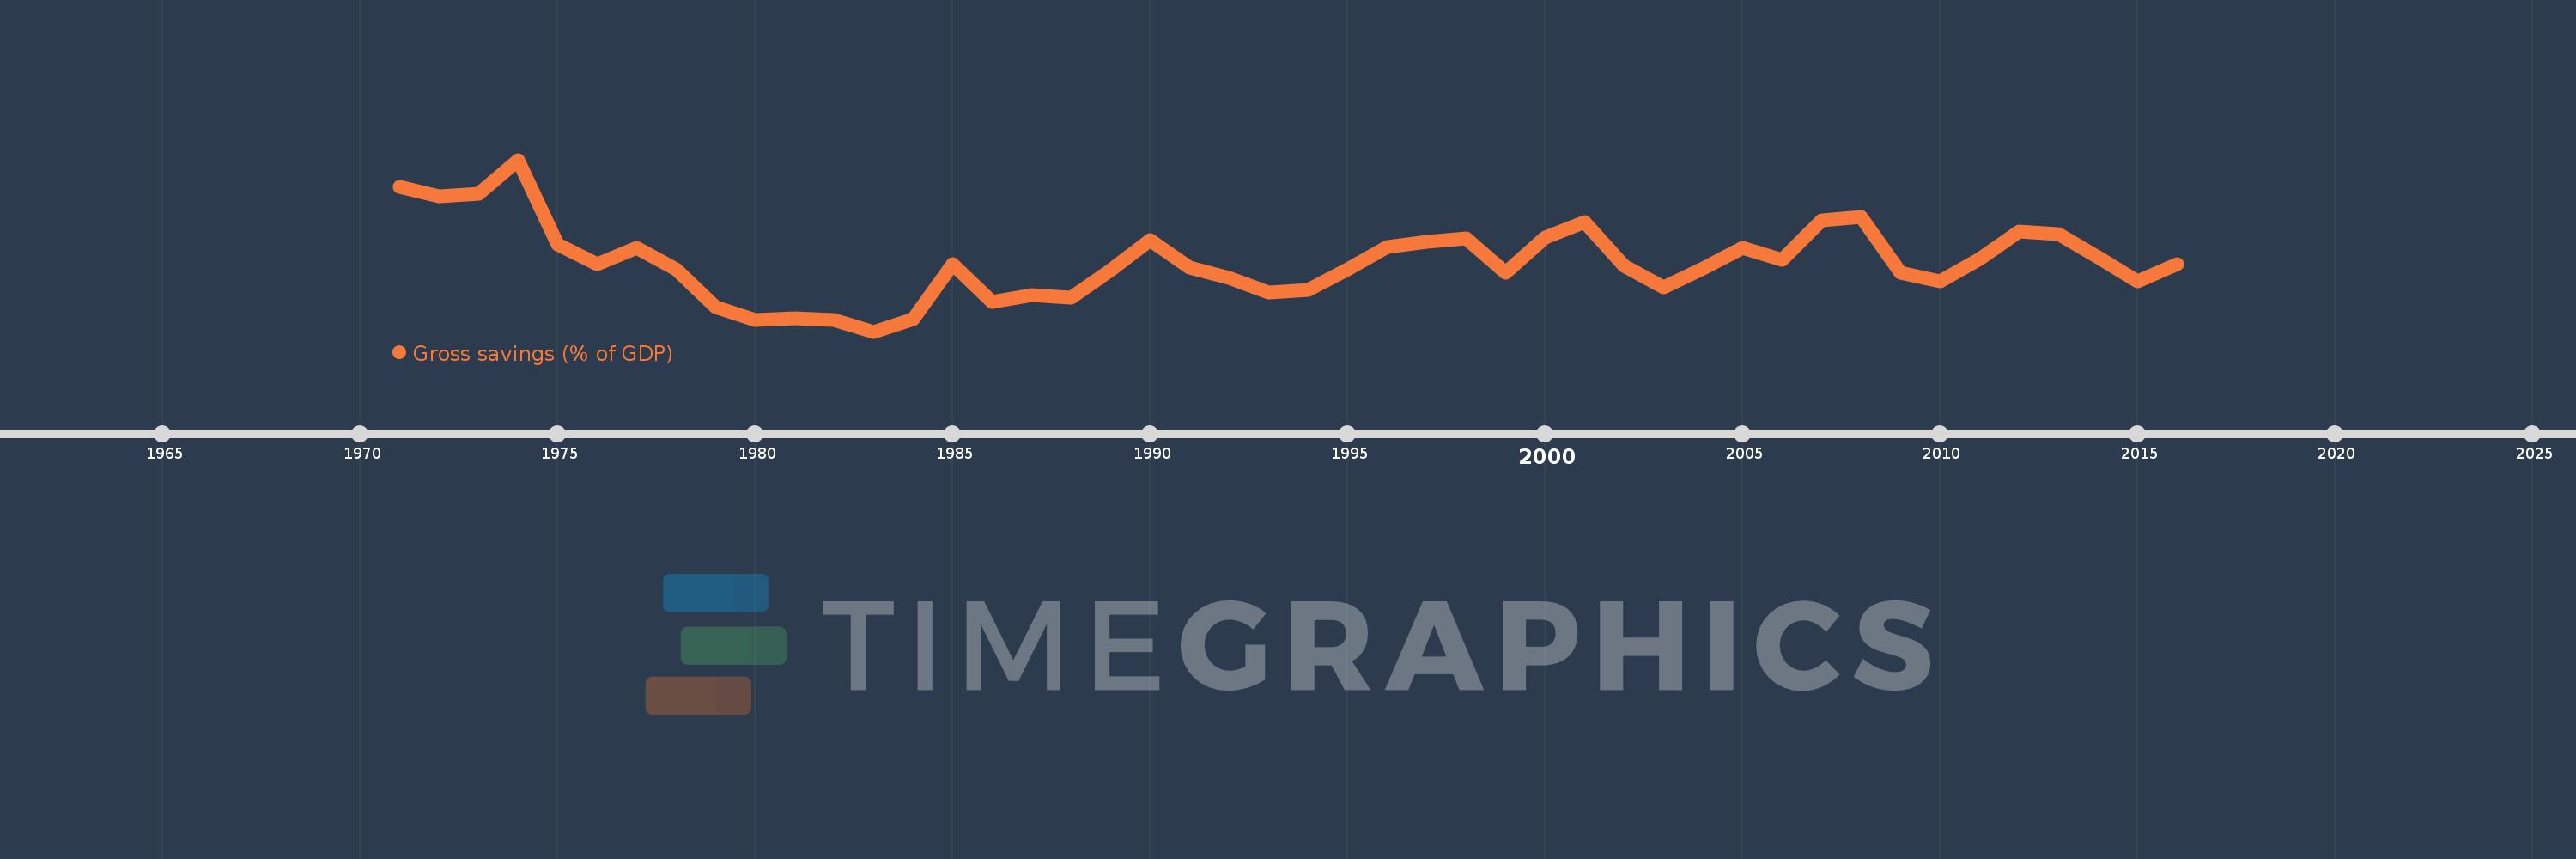
Gross savings (% of GDP)
2016,2015,2014,2013,2012,2011,2010,2009,2008,2007,2006,2005,2004,2003,2002,2001,2000,1999,1998,1997,1996,1995,1994,1993,1992,1991,1990,1989,1988,1987,1986,1985,1984,1983,1982,1981,1980,1979,1978,1977,1976,1975,1974,1973,1972,1971
Estas estadísticas en otros países:
AfghanistanAlbaniaAlgeriaAngolaAntigua and BarbudaArab WorldArgentinaArmeniaAustraliaAustriaAzerbaijanBahamas, TheBahrainBangladeshBarbadosBelarusBelgiumBelizeBeninBermudaBhutanBoliviaBosnia and HerzegovinaBotswanaBrazilBrunei DarussalamBulgariaBurkina FasoBurundiCabo VerdeCambodiaCameroonCanadaCaribbean small statesCentral African RepublicCentral Europe and the BalticsChadChileChinaColombiaComorosCongo, Dem. Rep.Congo, Rep.Costa RicaCote d'IvoireCroatiaCyprusCzech RepublicDenmarkDjiboutiDominicaDominican RepublicEarly-demographic dividendEast Asia & PacificEast Asia & Pacific (excluding high income)East Asia & Pacific (IDA & IBRD countries)EcuadorEgypt, Arab Rep.El SalvadorEquatorial GuineaEritreaEstoniaEthiopiaEuro areaEurope & Central AsiaEurope & Central Asia (excluding high income)Europe & Central Asia (IDA & IBRD countries)European UnionFaroe IslandsFijiFinlandFragile and conflict affected situationsFranceGabonGambia, TheGeorgiaGermanyGhanaGreeceGrenadaGuatemalaGuineaGuinea-BissauGuyanaHaitiHeavily indebted poor countries (HIPC)High incomeHondurasHong Kong SAR, ChinaHungaryIBRD onlyIcelandIDA & IBRD totalIDA blendIDA onlyIDA totalIndiaIndonesiaIran, Islamic Rep.IraqIrelandIsraelItalyJamaicaJapanJordanKazakhstanKenyaKiribatiKorea, Rep.KosovoKuwaitKyrgyz RepublicLao PDRLate-demographic dividendLatin America & Caribbean Latin America & Caribbean (excluding high income)Latin America & the Caribbean (IDA & IBRD countries)LatviaLeast developed countries: UN classificationLebanonLesothoLiberiaLibyaLithuaniaLow & middle incomeLow incomeLower middle incomeLuxembourgMacao SAR, ChinaMacedonia, FYRMadagascarMalawiMalaysiaMaldivesMaliMaltaMauritaniaMauritiusMexicoMiddle East & North AfricaMiddle East & North Africa (excluding high income)Middle East & North Africa (IDA & IBRD countries)Middle incomeMoldovaMongoliaMontenegroMoroccoMozambiqueNamibiaNepalNetherlandsNew ZealandNicaraguaNigerNigeriaNorth AmericaNorwayOECD membersOmanOther small statesPacific island small statesPakistanPanamaPapua New GuineaParaguayPeruPhilippinesPolandPortugalPost-demographic dividendPre-demographic dividendQatarRomaniaRussian FederationRwandaSaudi ArabiaSenegalSerbiaSeychellesSierra LeoneSingaporeSlovak RepublicSloveniaSmall statesSolomon IslandsSouth AfricaSouth AsiaSouth Asia (IDA & IBRD)South SudanSpainSri LankaSt. Kitts and NevisSt. LuciaSt. Vincent and the GrenadinesSub-Saharan Africa Sub-Saharan Africa (excluding high income)Sub-Saharan Africa (IDA & IBRD countries)SudanSurinameSwazilandSwedenSwitzerlandSyrian Arab RepublicTajikistanTanzaniaThailandTimor-LesteTogoTongaTrinidad and TobagoTunisiaTurkeyUgandaUkraineUnited KingdomUnited StatesUpper middle incomeUruguayVanuatuVenezuela, RBVietnamWest Bank and GazaWorldYemen, Rep.ZambiaZimbabwe línea de tiempo (timeline):
En esta escala de tiempo se presenta un gráfico de 1971 y 2016 de Netherlands. Los datos de 1970 están ausentes. El número de observaciones reales por fecha: 46.
Fuente (nombre):
Indicadores del desarrollo mundial
Fuente (organización):
World Bank national accounts data, and OECD National Accounts data files.
Categorías:
Economy & Growth
Se ha actualizado:
23 abr 2017 año
Los indicadores de los cambios de valor en los últimos años
Mínimo:
24.572
1 ene 1983 año
Máximo:
33.135
1 ene 1974 año
A la fecha de observación
Valor
Cambio absoluto
El cambio con respecto al valor anterior
1 ene 1971 año
31.794
+31.794
0.0%
1 ene 1972 año
31.322
-0.473
-1.49%
1 ene 1973 año
31.437
+0.115
0.37%
1 ene 1974 año
33.135
+1.698
5.4%
1 ene 1975 año
28.937
-4.198
-12.67%
1 ene 1976 año
27.95
-0.987
-3.41%
1 ene 1977 año
28.761
+0.811
2.9%
1 ene 1978 año
27.681
-1.08
-3.76%
1 ene 1979 año
25.795
-1.886
-6.81%
1 ene 1980 año
25.136
-0.659
-2.55%
1 ene 1981 año
25.241
+0.105
0.42%
1 ene 1982 año
25.16
-0.081
-0.32%
1 ene 1983 año
24.572
-0.587
-2.33%
1 ene 1984 año
25.21
+0.638
2.6%
1 ene 1985 año
27.948
+2.738
10.86%
1 ene 1986 año
26.041
-1.907
-6.82%
1 ene 1987 año
26.392
+0.35
1.35%
1 ene 1988 año
26.248
-0.144
-0.54%
1 ene 1989 año
27.632
+1.384
5.27%
1 ene 1990 año
29.134
+1.501
5.43%
1 ene 1991 año
27.761
-1.373
-4.71%
1 ene 1992 año
27.245
-0.516
-1.86%
1 ene 1993 año
26.539
-0.706
-2.59%
1 ene 1994 año
26.648
+0.109
0.41%
1 ene 1995 año
27.694
+1.046
3.93%
1 ene 1996 año
28.799
+1.105
3.99%
1 ene 1997 año
29.044
+0.245
0.85%
1 ene 1998 año
29.222
+0.178
0.61%
1 ene 1999 año
27.503
-1.718
-5.88%
1 ene 2000 año
29.259
+1.755
6.38%
1 ene 2001 año
30.031
+0.772
2.64%
1 ene 2002 año
27.827
-2.204
-7.34%
1 ene 2003 año
26.782
-1.045
-3.75%
1 ene 2004 año
27.724
+0.942
3.52%
1 ene 2005 año
28.728
+1.003
3.62%
1 ene 2006 año
28.134
-0.594
-2.07%
1 ene 2007 año
30.13
+1.995
7.09%
1 ene 2008 año
30.302
+0.172
0.57%
1 ene 2009 año
27.488
-2.814
-9.29%
1 ene 2010 año
27.072
-0.415
-1.51%
1 ene 2011 año
28.171
+1.099
4.06%
1 ene 2012 año
29.556
+1.385
4.92%
1 ene 2013 año
29.442
-0.114
-0.38%
1 ene 2014 año
28.291
-1.152
-3.91%
1 ene 2015 año
27.075
-1.216
-4.3%
1 ene 2016 año
27.932
+0.857
3.17%
Ranking de los países por los datos estadísticos actuales


Comentarios: