29
/es/
es
AIzaSyAYiBZKx7MnpbEhh9jyipgxe19OcubqV5w
April 1, 2024
43480
Latin America & the Caribbean (IDA & IBRD countries)
TLA
false
2
1
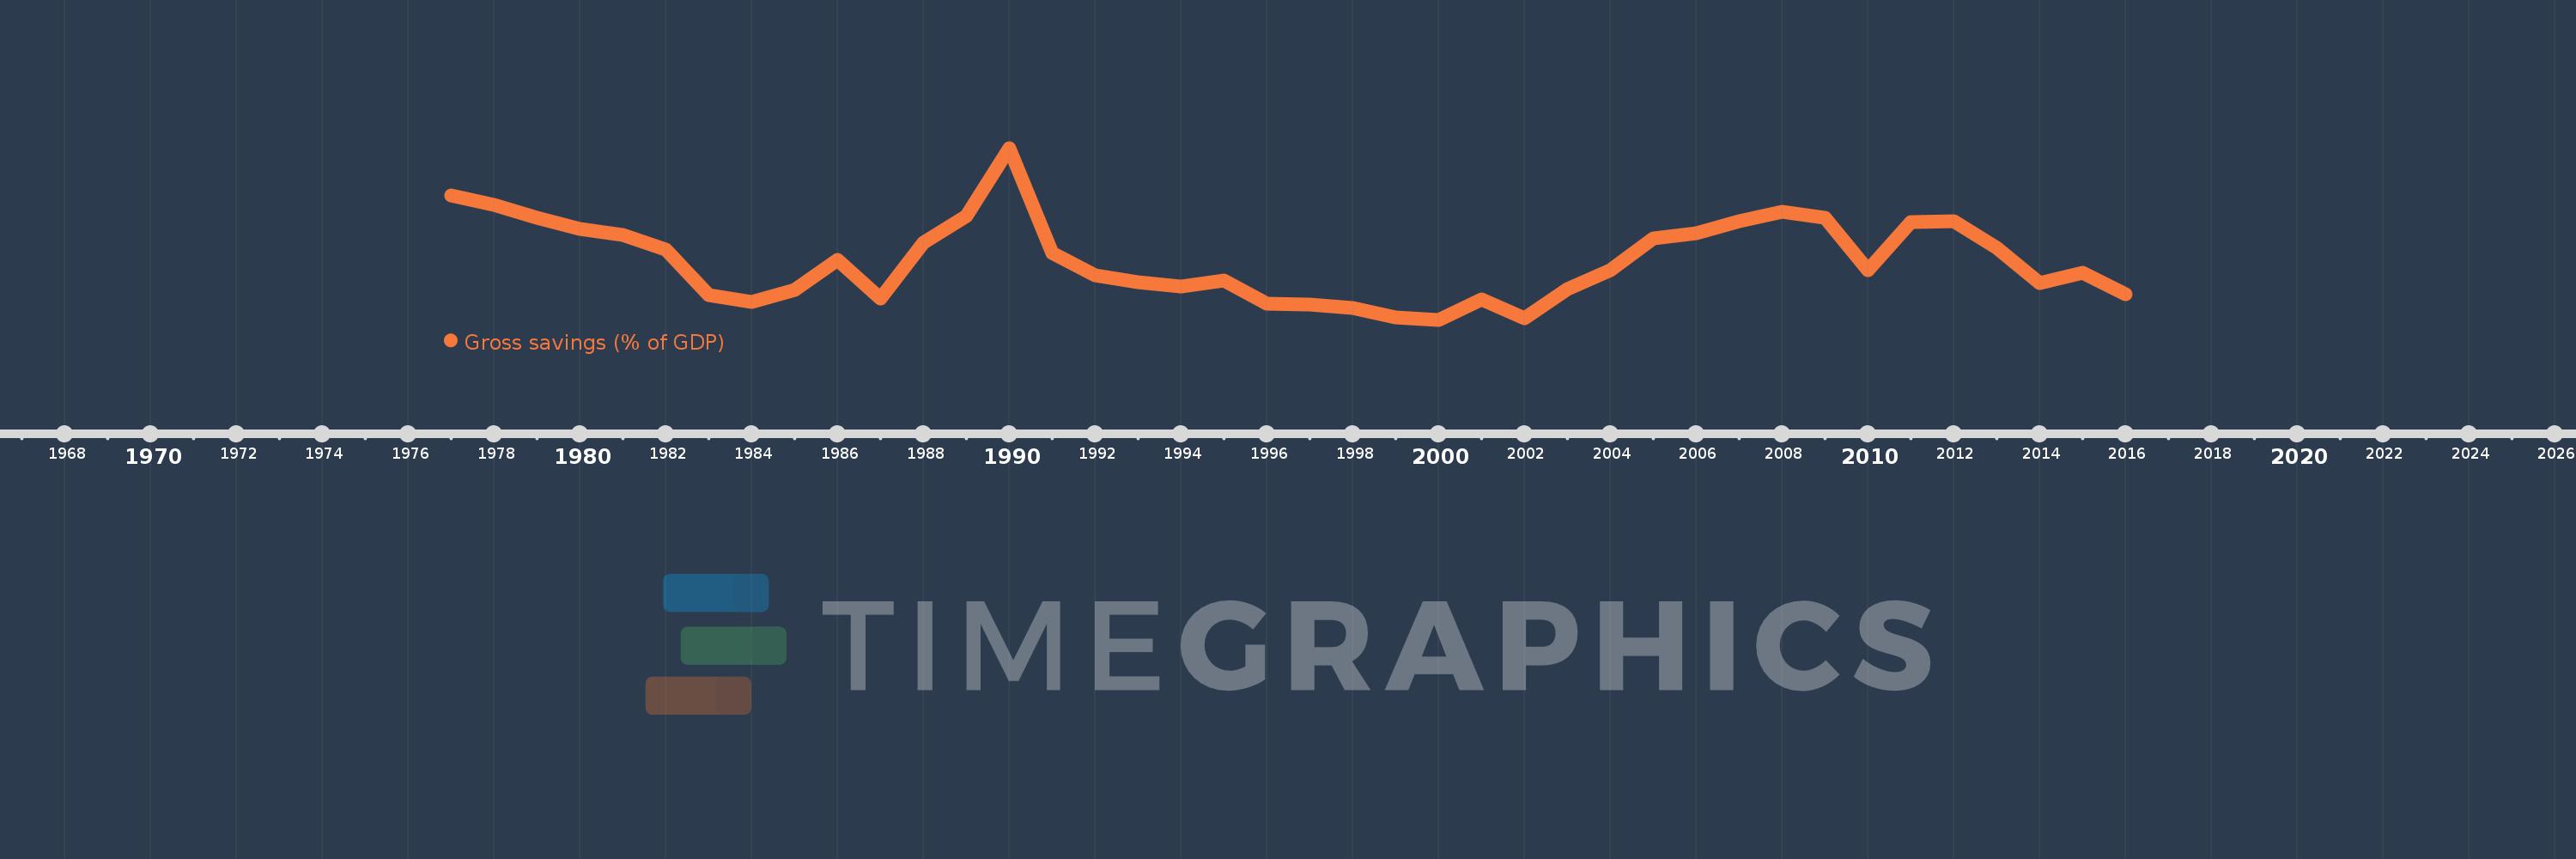
Gross savings (% of GDP)
2016,2015,2014,2013,2012,2011,2010,2009,2008,2007,2006,2005,2004,2003,2002,2001,2000,1999,1998,1997,1996,1995,1994,1993,1992,1991,1990,1989,1988,1987,1986,1985,1984,1983,1982,1981,1980,1979,1978,1977
Estas estadísticas en otros países:
AfghanistanAlbaniaAlgeriaAngolaAntigua and BarbudaArab WorldArgentinaArmeniaAustraliaAustriaAzerbaijanBahamas, TheBahrainBangladeshBarbadosBelarusBelgiumBelizeBeninBermudaBhutanBoliviaBosnia and HerzegovinaBotswanaBrazilBrunei DarussalamBulgariaBurkina FasoBurundiCabo VerdeCambodiaCameroonCanadaCaribbean small statesCentral African RepublicCentral Europe and the BalticsChadChileChinaColombiaComorosCongo, Dem. Rep.Congo, Rep.Costa RicaCote d'IvoireCroatiaCyprusCzech RepublicDenmarkDjiboutiDominicaDominican RepublicEarly-demographic dividendEast Asia & PacificEast Asia & Pacific (excluding high income)East Asia & Pacific (IDA & IBRD countries)EcuadorEgypt, Arab Rep.El SalvadorEquatorial GuineaEritreaEstoniaEthiopiaEuro areaEurope & Central AsiaEurope & Central Asia (excluding high income)Europe & Central Asia (IDA & IBRD countries)European UnionFaroe IslandsFijiFinlandFragile and conflict affected situationsFranceGabonGambia, TheGeorgiaGermanyGhanaGreeceGrenadaGuatemalaGuineaGuinea-BissauGuyanaHaitiHeavily indebted poor countries (HIPC)High incomeHondurasHong Kong SAR, ChinaHungaryIBRD onlyIcelandIDA & IBRD totalIDA blendIDA onlyIDA totalIndiaIndonesiaIran, Islamic Rep.IraqIrelandIsraelItalyJamaicaJapanJordanKazakhstanKenyaKiribatiKorea, Rep.KosovoKuwaitKyrgyz RepublicLao PDRLate-demographic dividendLatin America & Caribbean Latin America & Caribbean (excluding high income)Latin America & the Caribbean (IDA & IBRD countries)LatviaLeast developed countries: UN classificationLebanonLesothoLiberiaLibyaLithuaniaLow & middle incomeLow incomeLower middle incomeLuxembourgMacao SAR, ChinaMacedonia, FYRMadagascarMalawiMalaysiaMaldivesMaliMaltaMauritaniaMauritiusMexicoMiddle East & North AfricaMiddle East & North Africa (excluding high income)Middle East & North Africa (IDA & IBRD countries)Middle incomeMoldovaMongoliaMontenegroMoroccoMozambiqueNamibiaNepalNetherlandsNew ZealandNicaraguaNigerNigeriaNorth AmericaNorwayOECD membersOmanOther small statesPacific island small statesPakistanPanamaPapua New GuineaParaguayPeruPhilippinesPolandPortugalPost-demographic dividendPre-demographic dividendQatarRomaniaRussian FederationRwandaSaudi ArabiaSenegalSerbiaSeychellesSierra LeoneSingaporeSlovak RepublicSloveniaSmall statesSolomon IslandsSouth AfricaSouth AsiaSouth Asia (IDA & IBRD)South SudanSpainSri LankaSt. Kitts and NevisSt. LuciaSt. Vincent and the GrenadinesSub-Saharan Africa Sub-Saharan Africa (excluding high income)Sub-Saharan Africa (IDA & IBRD countries)SudanSurinameSwazilandSwedenSwitzerlandSyrian Arab RepublicTajikistanTanzaniaThailandTimor-LesteTogoTongaTrinidad and TobagoTunisiaTurkeyUgandaUkraineUnited KingdomUnited StatesUpper middle incomeUruguayVanuatuVenezuela, RBVietnamWest Bank and GazaWorldYemen, Rep.ZambiaZimbabwe línea de tiempo (timeline):
En esta escala de tiempo se presenta un gráfico de 1977 y 2016 de Latin America & the Caribbean (IDA & IBRD countries). Los datos de 1976 están ausentes. El número de observaciones reales por fecha: 40.
Fuente (nombre):
Indicadores del desarrollo mundial
Fuente (organización):
World Bank national accounts data, and OECD National Accounts data files.
Categorías:
Economy & Growth
Se ha actualizado:
23 abr 2017 año
Los indicadores de los cambios de valor en los últimos años
Mínimo:
15.701
1 ene 2000 año
Máximo:
25.477
1 ene 1990 año
A la fecha de observación
Valor
Cambio absoluto
El cambio con respecto al valor anterior
1 ene 1977 año
22.78
+22.78
0.0%
1 ene 1978 año
22.243
-0.537
-2.36%
1 ene 1979 año
21.499
-0.744
-3.34%
1 ene 1980 año
20.855
-0.644
-3.0%
1 ene 1981 año
20.548
-0.307
-1.47%
1 ene 1982 año
19.676
-0.872
-4.24%
1 ene 1983 año
17.091
-2.585
-13.14%
1 ene 1984 año
16.713
-0.378
-2.21%
1 ene 1985 año
17.395
+0.682
4.08%
1 ene 1986 año
19.096
+1.701
9.78%
1 ene 1987 año
16.9
-2.196
-11.5%
1 ene 1988 año
20.091
+3.192
18.89%
1 ene 1989 año
21.591
+1.5
7.46%
1 ene 1990 año
25.477
+3.886
18.0%
1 ene 1991 año
19.512
-5.965
-23.41%
1 ene 1992 año
18.22
-1.292
-6.62%
1 ene 1993 año
17.819
-0.4
-2.2%
1 ene 1994 año
17.605
-0.214
-1.2%
1 ene 1995 año
17.939
+0.334
1.89%
1 ene 1996 año
16.629
-1.31
-7.3%
1 ene 1997 año
16.569
-0.06
-0.36%
1 ene 1998 año
16.384
-0.185
-1.12%
1 ene 1999 año
15.813
-0.57
-3.48%
1 ene 2000 año
15.701
-0.112
-0.71%
1 ene 2001 año
16.854
+1.153
7.34%
1 ene 2002 año
15.804
-1.05
-6.23%
1 ene 2003 año
17.425
+1.621
10.26%
1 ene 2004 año
18.526
+1.1
6.31%
1 ene 2005 año
20.343
+1.817
9.81%
1 ene 2006 año
20.629
+0.286
1.41%
1 ene 2007 año
21.292
+0.663
3.21%
1 ene 2008 año
21.843
+0.552
2.59%
1 ene 2009 año
21.479
-0.364
-1.67%
1 ene 2010 año
18.54
-2.939
-13.68%
1 ene 2011 año
21.24
+2.7
14.56%
1 ene 2012 año
21.29
+0.051
0.24%
1 ene 2013 año
19.774
-1.517
-7.12%
1 ene 2014 año
17.798
-1.976
-9.99%
1 ene 2015 año
18.372
+0.575
3.23%
1 ene 2016 año
17.171
-1.201
-6.54%
Ranking de los países por los datos estadísticos actuales


Comentarios: