29
/es/
es
AIzaSyAYiBZKx7MnpbEhh9jyipgxe19OcubqV5w
April 1, 2024
36622
IBRD only
IBD
false
2
1
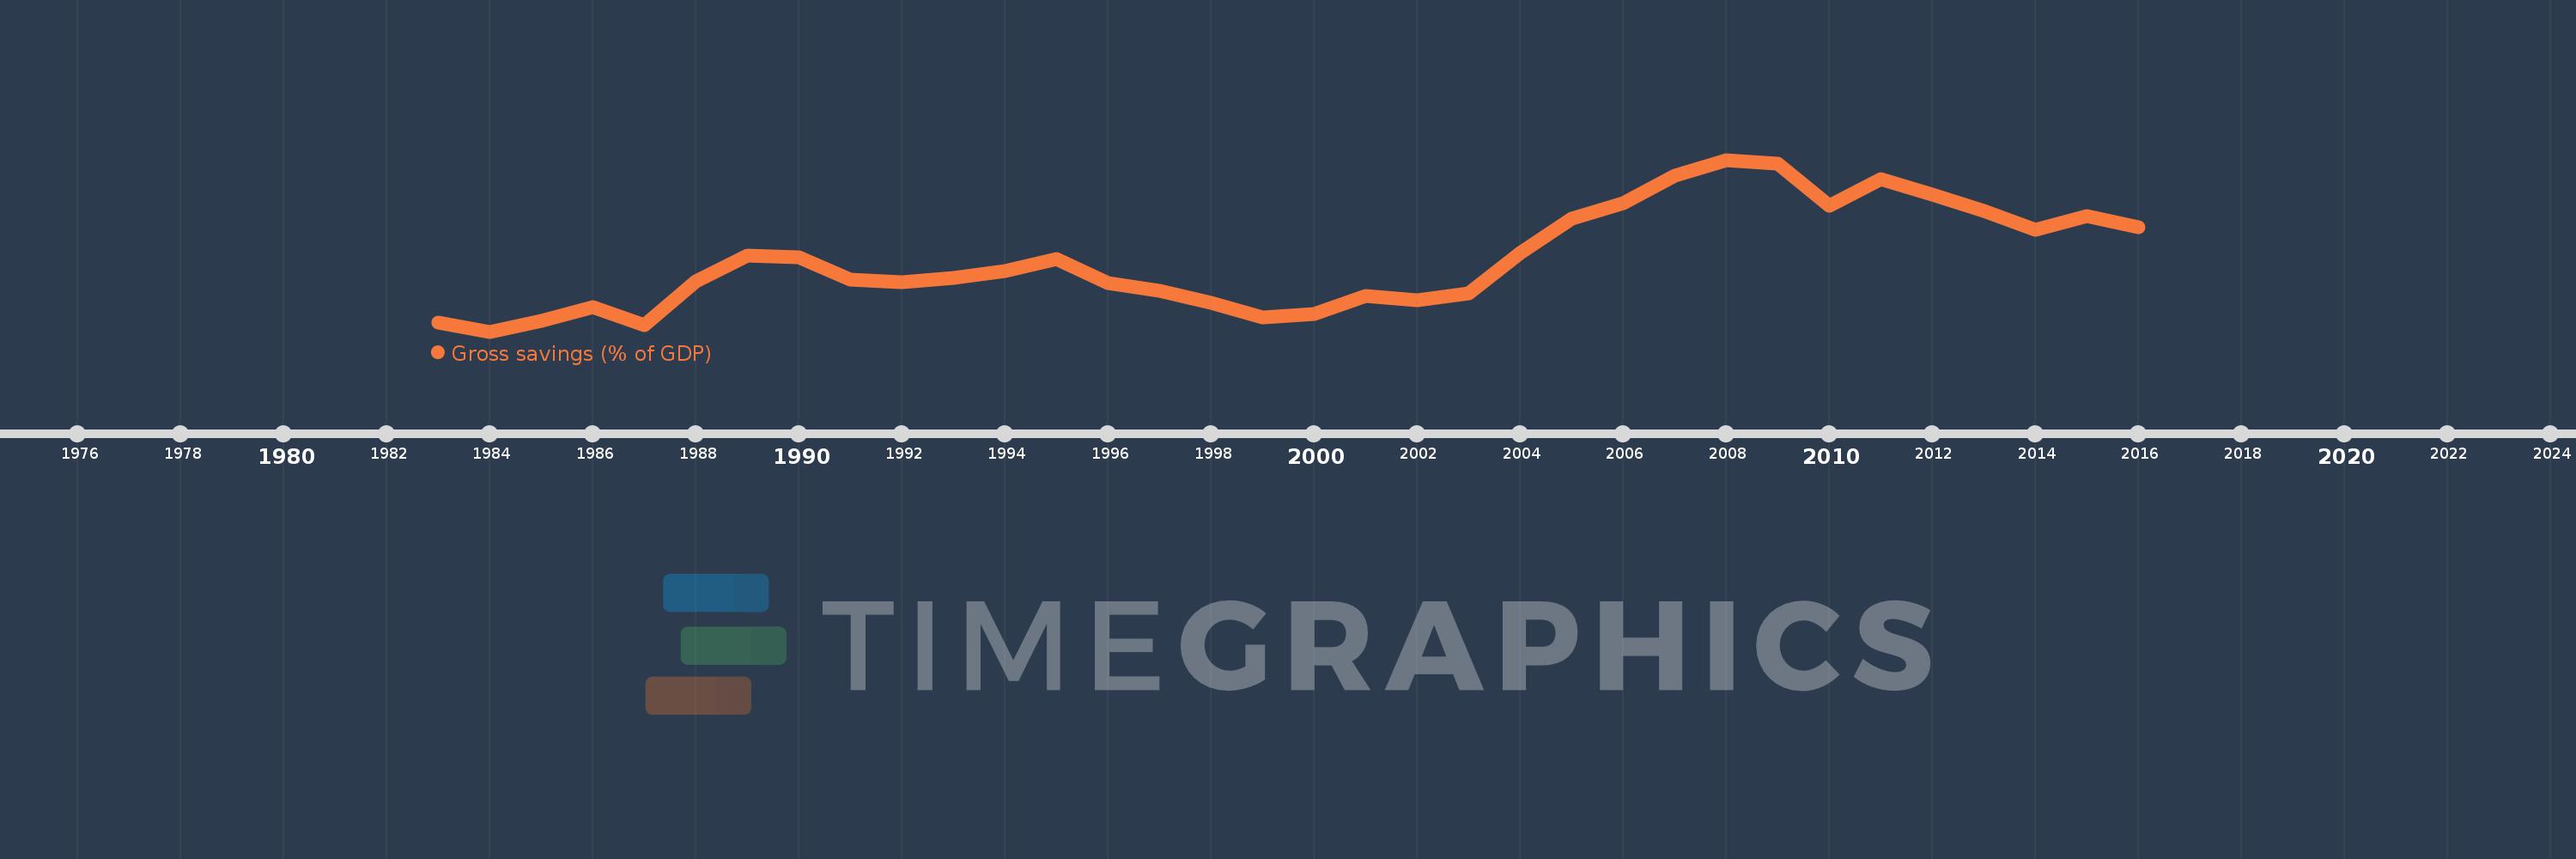
Gross savings (% of GDP)
2016,2015,2014,2013,2012,2011,2010,2009,2008,2007,2006,2005,2004,2003,2002,2001,2000,1999,1998,1997,1996,1995,1994,1993,1992,1991,1990,1989,1988,1987,1986,1985,1984,1983
Estas estadísticas en otros países:
AfghanistanAlbaniaAlgeriaAngolaAntigua and BarbudaArab WorldArgentinaArmeniaAustraliaAustriaAzerbaijanBahamas, TheBahrainBangladeshBarbadosBelarusBelgiumBelizeBeninBermudaBhutanBoliviaBosnia and HerzegovinaBotswanaBrazilBrunei DarussalamBulgariaBurkina FasoBurundiCabo VerdeCambodiaCameroonCanadaCaribbean small statesCentral African RepublicCentral Europe and the BalticsChadChileChinaColombiaComorosCongo, Dem. Rep.Congo, Rep.Costa RicaCote d'IvoireCroatiaCyprusCzech RepublicDenmarkDjiboutiDominicaDominican RepublicEarly-demographic dividendEast Asia & PacificEast Asia & Pacific (excluding high income)East Asia & Pacific (IDA & IBRD countries)EcuadorEgypt, Arab Rep.El SalvadorEquatorial GuineaEritreaEstoniaEthiopiaEuro areaEurope & Central AsiaEurope & Central Asia (excluding high income)Europe & Central Asia (IDA & IBRD countries)European UnionFaroe IslandsFijiFinlandFragile and conflict affected situationsFranceGabonGambia, TheGeorgiaGermanyGhanaGreeceGrenadaGuatemalaGuineaGuinea-BissauGuyanaHaitiHeavily indebted poor countries (HIPC)High incomeHondurasHong Kong SAR, ChinaHungaryIBRD onlyIcelandIDA & IBRD totalIDA blendIDA onlyIDA totalIndiaIndonesiaIran, Islamic Rep.IraqIrelandIsraelItalyJamaicaJapanJordanKazakhstanKenyaKiribatiKorea, Rep.KosovoKuwaitKyrgyz RepublicLao PDRLate-demographic dividendLatin America & Caribbean Latin America & Caribbean (excluding high income)Latin America & the Caribbean (IDA & IBRD countries)LatviaLeast developed countries: UN classificationLebanonLesothoLiberiaLibyaLithuaniaLow & middle incomeLow incomeLower middle incomeLuxembourgMacao SAR, ChinaMacedonia, FYRMadagascarMalawiMalaysiaMaldivesMaliMaltaMauritaniaMauritiusMexicoMiddle East & North AfricaMiddle East & North Africa (excluding high income)Middle East & North Africa (IDA & IBRD countries)Middle incomeMoldovaMongoliaMontenegroMoroccoMozambiqueNamibiaNepalNetherlandsNew ZealandNicaraguaNigerNigeriaNorth AmericaNorwayOECD membersOmanOther small statesPacific island small statesPakistanPanamaPapua New GuineaParaguayPeruPhilippinesPolandPortugalPost-demographic dividendPre-demographic dividendQatarRomaniaRussian FederationRwandaSaudi ArabiaSenegalSerbiaSeychellesSierra LeoneSingaporeSlovak RepublicSloveniaSmall statesSolomon IslandsSouth AfricaSouth AsiaSouth Asia (IDA & IBRD)South SudanSpainSri LankaSt. Kitts and NevisSt. LuciaSt. Vincent and the GrenadinesSub-Saharan Africa Sub-Saharan Africa (excluding high income)Sub-Saharan Africa (IDA & IBRD countries)SudanSurinameSwazilandSwedenSwitzerlandSyrian Arab RepublicTajikistanTanzaniaThailandTimor-LesteTogoTongaTrinidad and TobagoTunisiaTurkeyUgandaUkraineUnited KingdomUnited StatesUpper middle incomeUruguayVanuatuVenezuela, RBVietnamWest Bank and GazaWorldYemen, Rep.ZambiaZimbabwe línea de tiempo (timeline):
En esta escala de tiempo se presenta un gráfico de 1983 y 2016 de IBRD only. Los datos de 1982 están ausentes. El número de observaciones reales por fecha: 34.
Fuente (nombre):
Indicadores del desarrollo mundial
Fuente (organización):
World Bank national accounts data, and OECD National Accounts data files.
Categorías:
Economy & Growth
Se ha actualizado:
23 abr 2017 año
Los indicadores de los cambios de valor en los últimos años
Mínimo:
25.268
1 ene 1984 año
Máximo:
35.07
1 ene 2008 año
A la fecha de observación
Valor
Cambio absoluto
El cambio con respecto al valor anterior
1 ene 1983 año
25.794
+25.794
0.0%
1 ene 1984 año
25.268
-0.526
-2.04%
1 ene 1985 año
25.895
+0.627
2.48%
1 ene 1986 año
26.655
+0.76
2.93%
1 ene 1987 año
25.628
-1.027
-3.85%
1 ene 1988 año
28.112
+2.484
9.69%
1 ene 1989 año
29.602
+1.489
5.3%
1 ene 1990 año
29.521
-0.081
-0.27%
1 ene 1991 año
28.218
-1.302
-4.41%
1 ene 1992 año
28.069
-0.149
-0.53%
1 ene 1993 año
28.343
+0.273
0.97%
1 ene 1994 año
28.734
+0.391
1.38%
1 ene 1995 año
29.386
+0.652
2.27%
1 ene 1996 año
28.053
-1.333
-4.54%
1 ene 1997 año
27.595
-0.458
-1.63%
1 ene 1998 año
26.914
-0.682
-2.47%
1 ene 1999 año
26.065
-0.849
-3.15%
1 ene 2000 año
26.269
+0.204
0.78%
1 ene 2001 año
27.326
+1.057
4.02%
1 ene 2002 año
27.034
-0.292
-1.07%
1 ene 2003 año
27.425
+0.391
1.45%
1 ene 2004 año
29.76
+2.334
8.51%
1 ene 2005 año
31.734
+1.974
6.63%
1 ene 2006 año
32.591
+0.857
2.7%
1 ene 2007 año
34.154
+1.563
4.79%
1 ene 2008 año
35.07
+0.916
2.68%
1 ene 2009 año
34.828
-0.241
-0.69%
1 ene 2010 año
32.456
-2.372
-6.81%
1 ene 2011 año
33.979
+1.523
4.69%
1 ene 2012 año
33.078
-0.9
-2.65%
1 ene 2013 año
32.138
-0.94
-2.84%
1 ene 2014 año
31.087
-1.051
-3.27%
1 ene 2015 año
31.854
+0.766
2.47%
1 ene 2016 año
31.212
-0.642
-2.02%
Ranking de los países por los datos estadísticos actuales


Comentarios: