29
/es/
es
AIzaSyAYiBZKx7MnpbEhh9jyipgxe19OcubqV5w
April 1, 2024
148010
Guyana
GUY
true
2
1
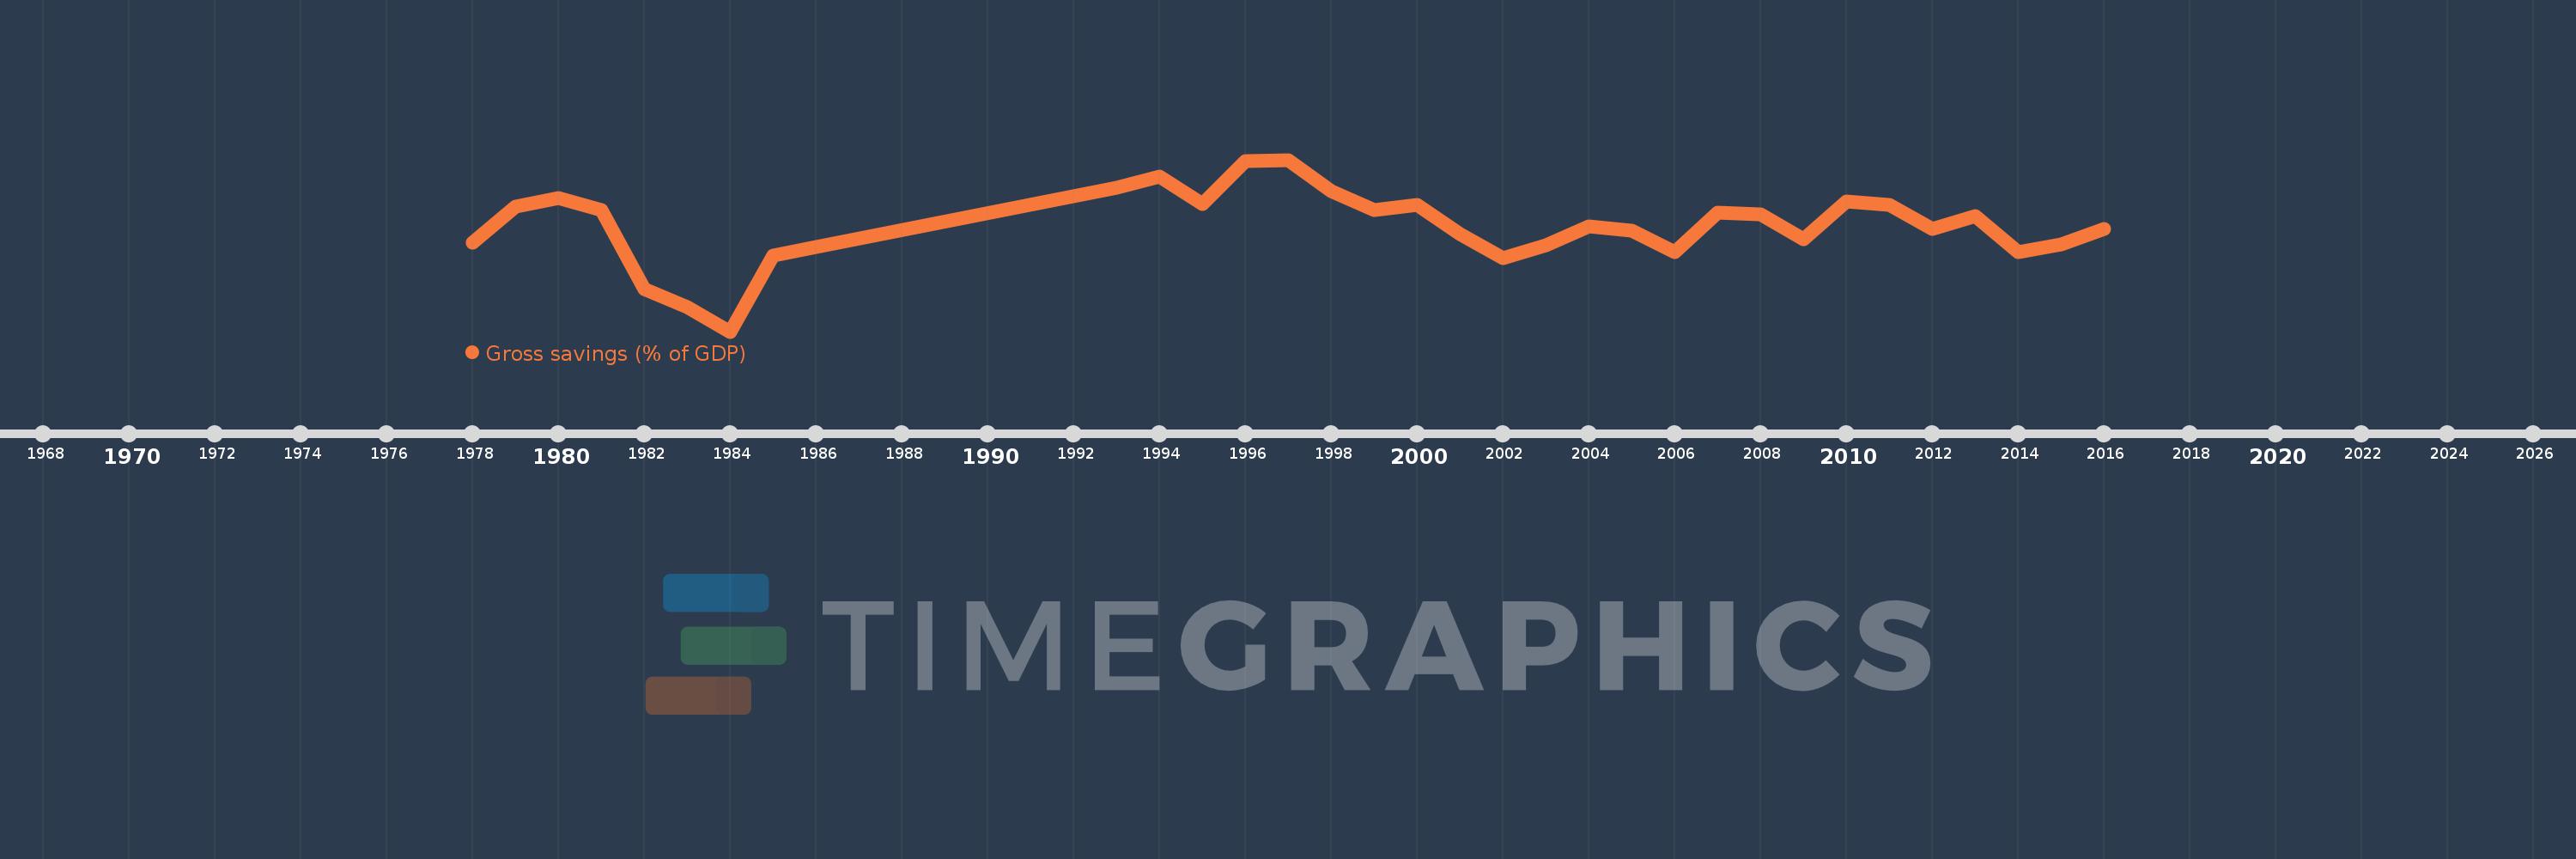
Gross savings (% of GDP)
2016,2015,2014,2013,2012,2011,2010,2009,2008,2007,2006,2005,2004,2003,2002,2001,2000,1999,1998,1997,1996,1995,1994,1993,1986,1985,1984,1983,1982,1981,1980,1979,1978
Estas estadísticas en otros países:
AfghanistanAlbaniaAlgeriaAngolaAntigua and BarbudaArab WorldArgentinaArmeniaAustraliaAustriaAzerbaijanBahamas, TheBahrainBangladeshBarbadosBelarusBelgiumBelizeBeninBermudaBhutanBoliviaBosnia and HerzegovinaBotswanaBrazilBrunei DarussalamBulgariaBurkina FasoBurundiCabo VerdeCambodiaCameroonCanadaCaribbean small statesCentral African RepublicCentral Europe and the BalticsChadChileChinaColombiaComorosCongo, Dem. Rep.Congo, Rep.Costa RicaCote d'IvoireCroatiaCyprusCzech RepublicDenmarkDjiboutiDominicaDominican RepublicEarly-demographic dividendEast Asia & PacificEast Asia & Pacific (excluding high income)East Asia & Pacific (IDA & IBRD countries)EcuadorEgypt, Arab Rep.El SalvadorEquatorial GuineaEritreaEstoniaEthiopiaEuro areaEurope & Central AsiaEurope & Central Asia (excluding high income)Europe & Central Asia (IDA & IBRD countries)European UnionFaroe IslandsFijiFinlandFragile and conflict affected situationsFranceGabonGambia, TheGeorgiaGermanyGhanaGreeceGrenadaGuatemalaGuineaGuinea-BissauGuyanaHaitiHeavily indebted poor countries (HIPC)High incomeHondurasHong Kong SAR, ChinaHungaryIBRD onlyIcelandIDA & IBRD totalIDA blendIDA onlyIDA totalIndiaIndonesiaIran, Islamic Rep.IraqIrelandIsraelItalyJamaicaJapanJordanKazakhstanKenyaKiribatiKorea, Rep.KosovoKuwaitKyrgyz RepublicLao PDRLate-demographic dividendLatin America & Caribbean Latin America & Caribbean (excluding high income)Latin America & the Caribbean (IDA & IBRD countries)LatviaLeast developed countries: UN classificationLebanonLesothoLiberiaLibyaLithuaniaLow & middle incomeLow incomeLower middle incomeLuxembourgMacao SAR, ChinaMacedonia, FYRMadagascarMalawiMalaysiaMaldivesMaliMaltaMauritaniaMauritiusMexicoMiddle East & North AfricaMiddle East & North Africa (excluding high income)Middle East & North Africa (IDA & IBRD countries)Middle incomeMoldovaMongoliaMontenegroMoroccoMozambiqueNamibiaNepalNetherlandsNew ZealandNicaraguaNigerNigeriaNorth AmericaNorwayOECD membersOmanOther small statesPacific island small statesPakistanPanamaPapua New GuineaParaguayPeruPhilippinesPolandPortugalPost-demographic dividendPre-demographic dividendQatarRomaniaRussian FederationRwandaSaudi ArabiaSenegalSerbiaSeychellesSierra LeoneSingaporeSlovak RepublicSloveniaSmall statesSolomon IslandsSouth AfricaSouth AsiaSouth Asia (IDA & IBRD)South SudanSpainSri LankaSt. Kitts and NevisSt. LuciaSt. Vincent and the GrenadinesSub-Saharan Africa Sub-Saharan Africa (excluding high income)Sub-Saharan Africa (IDA & IBRD countries)SudanSurinameSwazilandSwedenSwitzerlandSyrian Arab RepublicTajikistanTanzaniaThailandTimor-LesteTogoTongaTrinidad and TobagoTunisiaTurkeyUgandaUkraineUnited KingdomUnited StatesUpper middle incomeUruguayVanuatuVenezuela, RBVietnamWest Bank and GazaWorldYemen, Rep.ZambiaZimbabwe línea de tiempo (timeline):
En esta escala de tiempo se presenta un gráfico de 1978 y 2016 de Guyana. Los datos de 1977 están ausentes. El número de observaciones reales por fecha: 33.
Fuente (nombre):
Indicadores del desarrollo mundial
Fuente (organización):
World Bank national accounts data, and OECD National Accounts data files.
Categorías:
Economy & Growth
Se ha actualizado:
23 abr 2017 año
Los indicadores de los cambios de valor en los últimos años
Mínimo:
-11.751
1 ene 1984 año
Máximo:
23.772
1 ene 1997 año
A la fecha de observación
Valor
Cambio absoluto
El cambio con respecto al valor anterior
1 ene 1978 año
6.668
+6.668
0.0%
1 ene 1979 año
14.122
+7.454
111.78%
1 ene 1980 año
15.834
+1.713
12.13%
1 ene 1981 año
13.312
-2.523
-15.93%
1 ene 1982 año
-2.942
-16.254
-122.1%
1 ene 1983 año
-6.743
-3.801
129.18%
1 ene 1984 año
-11.751
-5.007
74.25%
1 ene 1985 año
3.97
+15.721
-133.79%
1 ene 1986 año
5.72
+1.75
44.09%
1 ene 1993 año
18.069
+12.349
215.87%
1 ene 1994 año
20.359
+2.289
12.67%
1 ene 1995 año
14.711
-5.648
-27.74%
1 ene 1996 año
23.558
+8.847
60.14%
1 ene 1997 año
23.772
+0.213
0.91%
1 ene 1998 año
17.244
-6.527
-27.46%
1 ene 1999 año
13.359
-3.886
-22.53%
1 ene 2000 año
14.416
+1.058
7.92%
1 ene 2001 año
8.45
-5.966
-41.39%
1 ene 2002 año
3.46
-4.99
-59.06%
1 ene 2003 año
6.164
+2.704
78.15%
1 ene 2004 año
9.991
+3.828
62.1%
1 ene 2005 año
9.133
-0.858
-8.59%
1 ene 2006 año
4.634
-4.5
-49.27%
1 ene 2007 año
12.887
+8.253
178.1%
1 ene 2008 año
12.41
-0.477
-3.7%
1 ene 2009 año
7.284
-5.126
-41.3%
1 ene 2010 año
15.227
+7.943
109.05%
1 ene 2011 año
14.478
-0.749
-4.92%
1 ene 2012 año
9.495
-4.982
-34.41%
1 ene 2013 año
12.093
+2.598
27.36%
1 ene 2014 año
4.681
-7.412
-61.29%
1 ene 2015 año
6.196
+1.515
32.37%
1 ene 2016 año
9.453
+3.257
52.56%
Ranking de los países por los datos estadísticos actuales


Comentarios: