29
/es/
es
AIzaSyAYiBZKx7MnpbEhh9jyipgxe19OcubqV5w
April 1, 2024
39962
IDA total
IDA
false
2
1
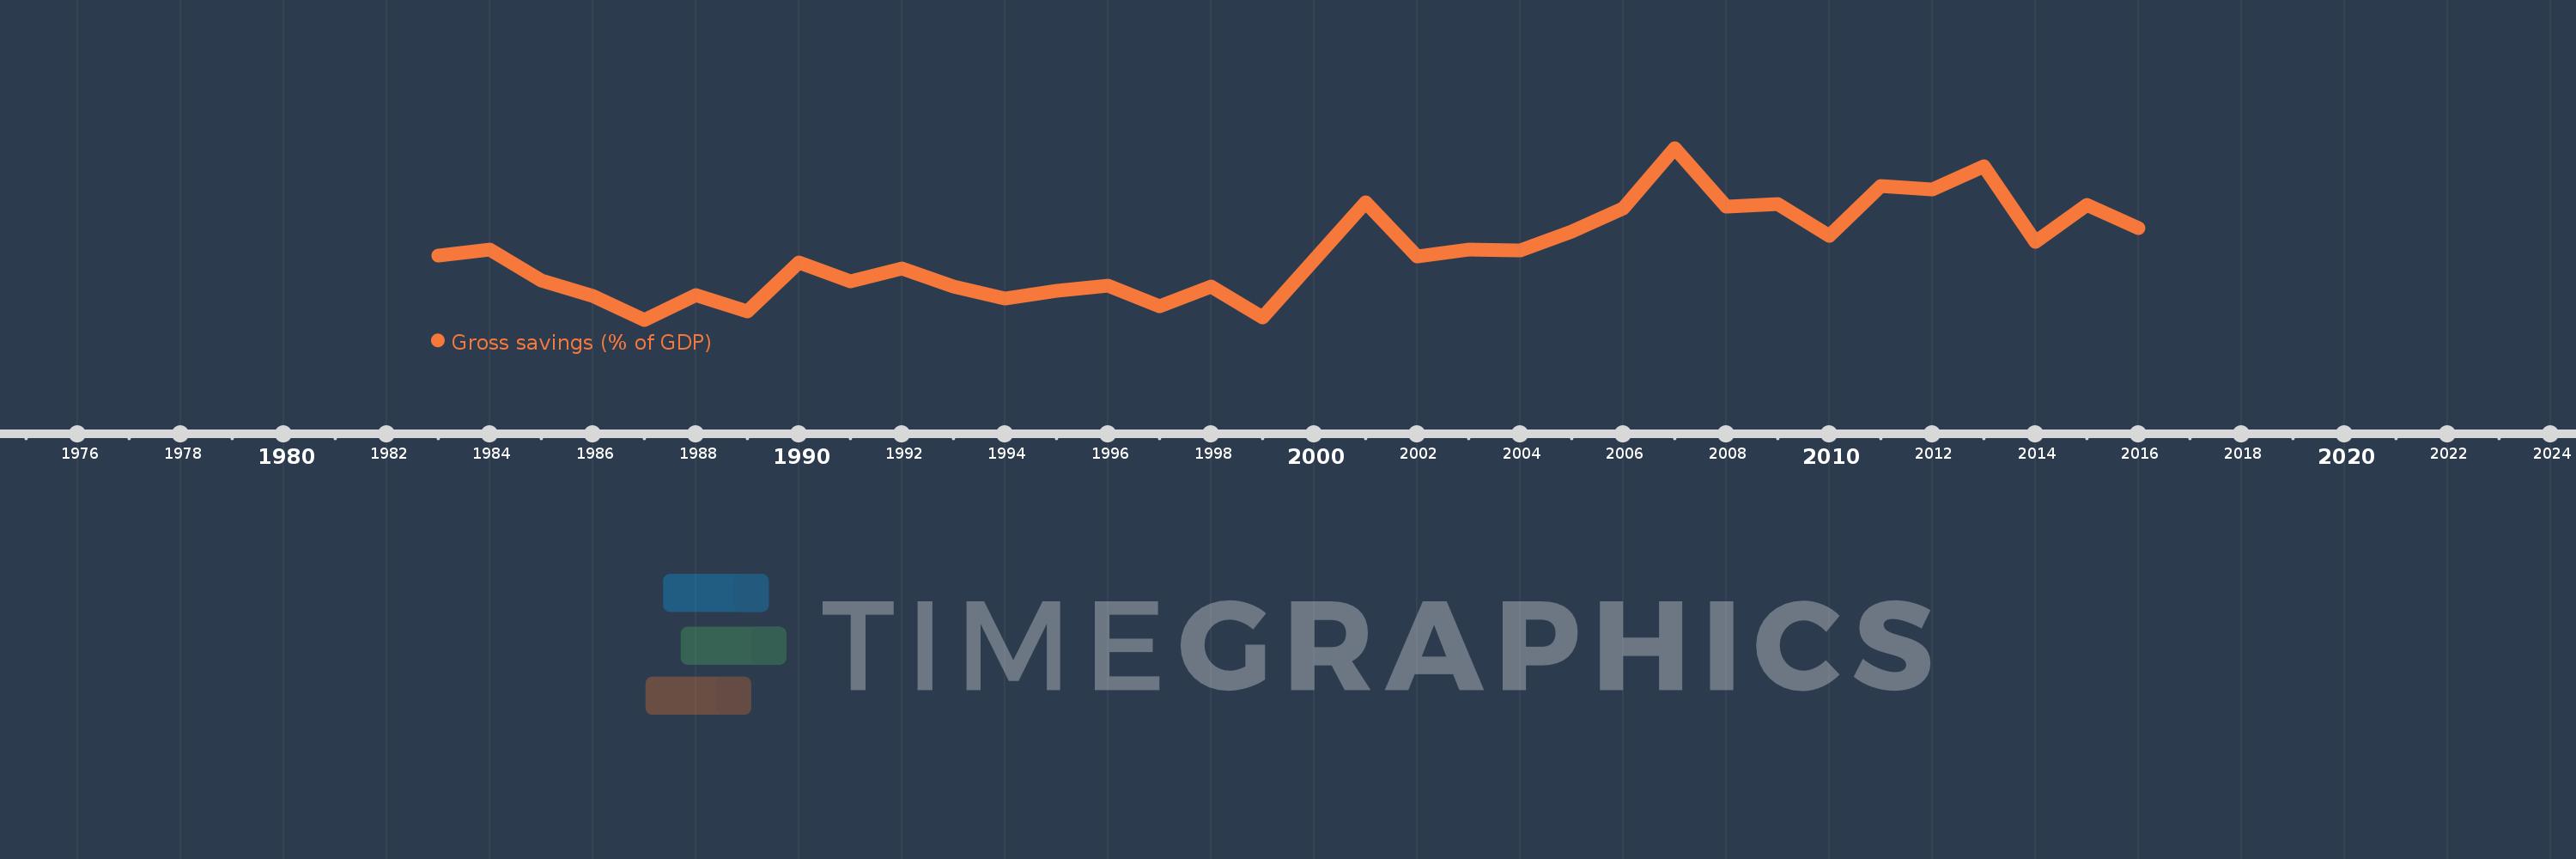
Gross savings (% of GDP)
2016,2015,2014,2013,2012,2011,2010,2009,2008,2007,2006,2005,2004,2003,2002,2001,1999,1998,1997,1996,1995,1994,1993,1992,1991,1990,1989,1988,1987,1986,1985,1984,1983
Estas estadísticas en otros países:
AfghanistanAlbaniaAlgeriaAngolaAntigua and BarbudaArab WorldArgentinaArmeniaAustraliaAustriaAzerbaijanBahamas, TheBahrainBangladeshBarbadosBelarusBelgiumBelizeBeninBermudaBhutanBoliviaBosnia and HerzegovinaBotswanaBrazilBrunei DarussalamBulgariaBurkina FasoBurundiCabo VerdeCambodiaCameroonCanadaCaribbean small statesCentral African RepublicCentral Europe and the BalticsChadChileChinaColombiaComorosCongo, Dem. Rep.Congo, Rep.Costa RicaCote d'IvoireCroatiaCyprusCzech RepublicDenmarkDjiboutiDominicaDominican RepublicEarly-demographic dividendEast Asia & PacificEast Asia & Pacific (excluding high income)East Asia & Pacific (IDA & IBRD countries)EcuadorEgypt, Arab Rep.El SalvadorEquatorial GuineaEritreaEstoniaEthiopiaEuro areaEurope & Central AsiaEurope & Central Asia (excluding high income)Europe & Central Asia (IDA & IBRD countries)European UnionFaroe IslandsFijiFinlandFragile and conflict affected situationsFranceGabonGambia, TheGeorgiaGermanyGhanaGreeceGrenadaGuatemalaGuineaGuinea-BissauGuyanaHaitiHeavily indebted poor countries (HIPC)High incomeHondurasHong Kong SAR, ChinaHungaryIBRD onlyIcelandIDA & IBRD totalIDA blendIDA onlyIDA totalIndiaIndonesiaIran, Islamic Rep.IraqIrelandIsraelItalyJamaicaJapanJordanKazakhstanKenyaKiribatiKorea, Rep.KosovoKuwaitKyrgyz RepublicLao PDRLate-demographic dividendLatin America & Caribbean Latin America & Caribbean (excluding high income)Latin America & the Caribbean (IDA & IBRD countries)LatviaLeast developed countries: UN classificationLebanonLesothoLiberiaLibyaLithuaniaLow & middle incomeLow incomeLower middle incomeLuxembourgMacao SAR, ChinaMacedonia, FYRMadagascarMalawiMalaysiaMaldivesMaliMaltaMauritaniaMauritiusMexicoMiddle East & North AfricaMiddle East & North Africa (excluding high income)Middle East & North Africa (IDA & IBRD countries)Middle incomeMoldovaMongoliaMontenegroMoroccoMozambiqueNamibiaNepalNetherlandsNew ZealandNicaraguaNigerNigeriaNorth AmericaNorwayOECD membersOmanOther small statesPacific island small statesPakistanPanamaPapua New GuineaParaguayPeruPhilippinesPolandPortugalPost-demographic dividendPre-demographic dividendQatarRomaniaRussian FederationRwandaSaudi ArabiaSenegalSerbiaSeychellesSierra LeoneSingaporeSlovak RepublicSloveniaSmall statesSolomon IslandsSouth AfricaSouth AsiaSouth Asia (IDA & IBRD)South SudanSpainSri LankaSt. Kitts and NevisSt. LuciaSt. Vincent and the GrenadinesSub-Saharan Africa Sub-Saharan Africa (excluding high income)Sub-Saharan Africa (IDA & IBRD countries)SudanSurinameSwazilandSwedenSwitzerlandSyrian Arab RepublicTajikistanTanzaniaThailandTimor-LesteTogoTongaTrinidad and TobagoTunisiaTurkeyUgandaUkraineUnited KingdomUnited StatesUpper middle incomeUruguayVanuatuVenezuela, RBVietnamWest Bank and GazaWorldYemen, Rep.ZambiaZimbabwe línea de tiempo (timeline):
En esta escala de tiempo se presenta un gráfico de 1983 y 2016 de IDA total. Los datos de 1982 están ausentes. El número de observaciones reales por fecha: 33.
Fuente (nombre):
Indicadores del desarrollo mundial
Fuente (organización):
World Bank national accounts data, and OECD National Accounts data files.
Categorías:
Economy & Growth
Se ha actualizado:
23 abr 2017 año
Los indicadores de los cambios de valor en los últimos años
Mínimo:
14.496
1 ene 1987 año
Máximo:
25.81
1 ene 2007 año
A la fecha de observación
Valor
Cambio absoluto
El cambio con respecto al valor anterior
1 ene 1983 año
18.721
+18.721
0.0%
1 ene 1984 año
19.108
+0.387
2.07%
1 ene 1985 año
17.075
-2.033
-10.64%
1 ene 1986 año
16.055
-1.02
-5.98%
1 ene 1987 año
14.496
-1.558
-9.71%
1 ene 1988 año
16.103
+1.607
11.08%
1 ene 1989 año
15.071
-1.032
-6.41%
1 ene 1990 año
18.25
+3.179
21.09%
1 ene 1991 año
17.022
-1.228
-6.73%
1 ene 1992 año
17.882
+0.86
5.05%
1 ene 1993 año
16.657
-1.225
-6.85%
1 ene 1994 año
15.877
-0.78
-4.68%
1 ene 1995 año
16.389
+0.512
3.23%
1 ene 1996 año
16.724
+0.335
2.04%
1 ene 1997 año
15.396
-1.328
-7.94%
1 ene 1998 año
16.662
+1.267
8.23%
1 ene 1999 año
14.632
-2.03
-12.18%
1 ene 2001 año
22.227
+7.595
51.9%
1 ene 2002 año
18.681
-3.546
-15.95%
1 ene 2003 año
19.127
+0.446
2.39%
1 ene 2004 año
19.038
-0.09
-0.47%
1 ene 2005 año
20.308
+1.27
6.67%
1 ene 2006 año
21.836
+1.528
7.53%
1 ene 2007 año
25.81
+3.974
18.2%
1 ene 2008 año
21.924
-3.886
-15.06%
1 ene 2009 año
22.121
+0.197
0.9%
1 ene 2010 año
20.049
-2.072
-9.37%
1 ene 2011 año
23.288
+3.24
16.16%
1 ene 2012 año
23.07
-0.218
-0.94%
1 ene 2013 año
24.61
+1.54
6.68%
1 ene 2014 año
19.625
-4.986
-20.26%
1 ene 2015 año
22.05
+2.426
12.36%
1 ene 2016 año
20.554
-1.496
-6.79%
Ranking de los países por los datos estadísticos actuales


Comentarios: