29
/es/
es
AIzaSyAYiBZKx7MnpbEhh9jyipgxe19OcubqV5w
April 1, 2024
66045
Algeria
DZA
true
2
1
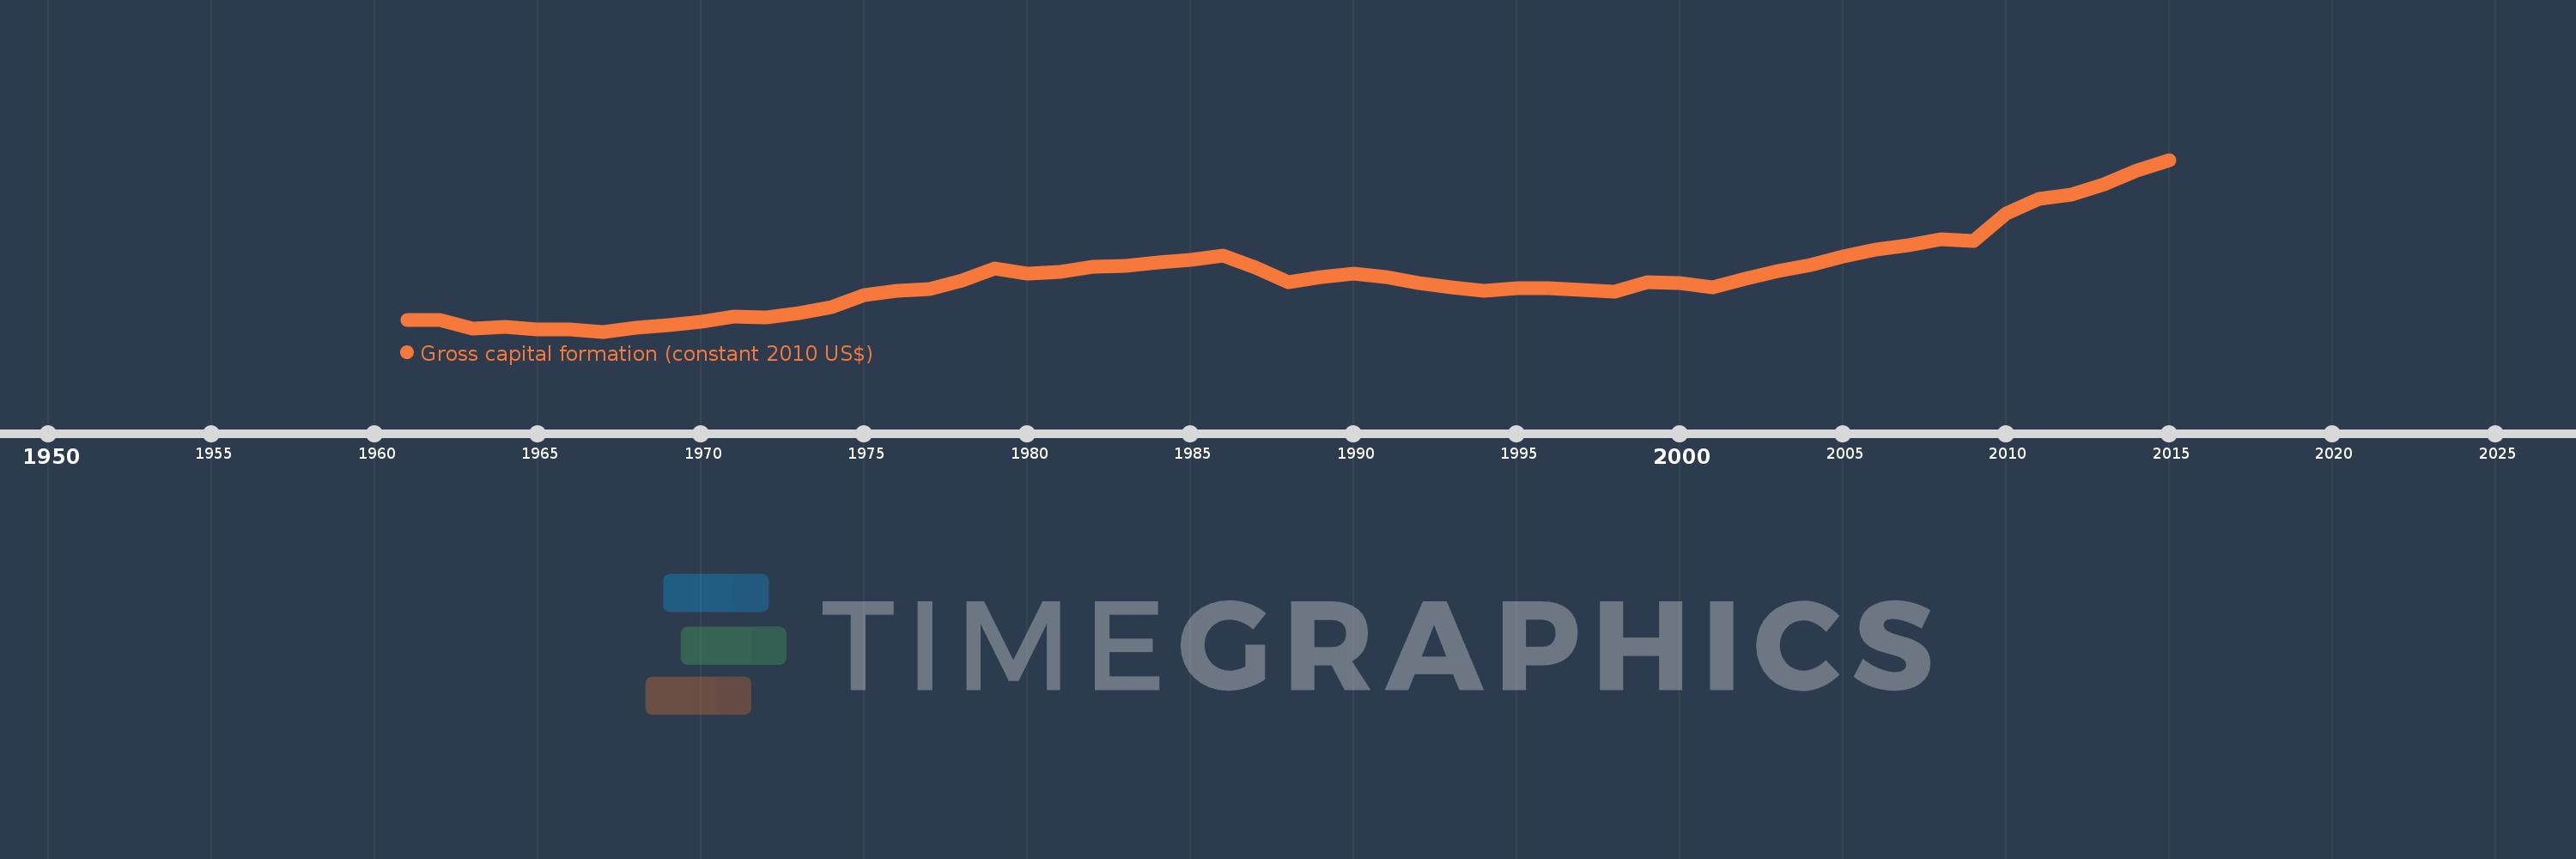
Gross capital formation (constant 2010 US$)
2015,2014,2013,2012,2011,2010,2009,2008,2007,2006,2005,2004,2003,2002,2001,2000,1999,1998,1997,1996,1995,1994,1993,1992,1991,1990,1989,1988,1987,1986,1985,1984,1983,1982,1981,1980,1979,1978,1977,1976,1975,1974,1973,1972,1971,1970,1969,1968,1967,1966,1965,1964,1963,1962,1961
Estas estadísticas en otros países:
AfghanistanAlbaniaAlgeriaAngolaAntigua and BarbudaArab WorldArgentinaArmeniaArubaAustraliaAustriaAzerbaijanBahamas, TheBahrainBangladeshBarbadosBelarusBelgiumBelizeBeninBermudaBhutanBoliviaBosnia and HerzegovinaBotswanaBrazilBrunei DarussalamBulgariaBurkina FasoBurundiCabo VerdeCambodiaCameroonCanadaCaribbean small statesCentral African RepublicCentral Europe and the BalticsChadChileChinaColombiaComorosCongo, Dem. Rep.Congo, Rep.Cote d'IvoireCroatiaCubaCyprusCzech RepublicDenmarkDominicaDominican RepublicEarly-demographic dividendEast Asia & PacificEast Asia & Pacific (excluding high income)East Asia & Pacific (IDA & IBRD countries)EcuadorEgypt, Arab Rep.El SalvadorEquatorial GuineaEritreaEstoniaEthiopiaEuro areaEurope & Central AsiaEurope & Central Asia (excluding high income)Europe & Central Asia (IDA & IBRD countries)European UnionFaroe IslandsFinlandFragile and conflict affected situationsFranceGabonGambia, TheGeorgiaGermanyGhanaGreeceGrenadaGuatemalaGuineaGuinea-BissauGuyanaHaitiHeavily indebted poor countries (HIPC)High incomeHondurasHong Kong SAR, ChinaHungaryIBRD onlyIcelandIDA & IBRD totalIDA blendIDA onlyIDA totalIndiaIndonesiaIran, Islamic Rep.IraqIrelandIsraelItalyJamaicaJapanJordanKazakhstanKenyaKorea, Rep.KosovoKuwaitKyrgyz RepublicLao PDRLate-demographic dividendLatin America & Caribbean Latin America & Caribbean (excluding high income)Latin America & the Caribbean (IDA & IBRD countries)LatviaLeast developed countries: UN classificationLebanonLiberiaLithuaniaLow & middle incomeLow incomeLower middle incomeLuxembourgMacao SAR, ChinaMacedonia, FYRMadagascarMalawiMalaysiaMaliMaltaMauritaniaMauritiusMexicoMiddle East & North AfricaMiddle East & North Africa (excluding high income)Middle East & North Africa (IDA & IBRD countries)Middle incomeMoldovaMongoliaMontenegroMoroccoMozambiqueNamibiaNepalNetherlandsNew ZealandNicaraguaNigerNigeriaNorth AmericaNorwayOECD membersOmanOther small statesPakistanPanamaParaguayPeruPhilippinesPolandPortugalPost-demographic dividendPre-demographic dividendPuerto RicoQatarRomaniaRussian FederationRwandaSaudi ArabiaSenegalSerbiaSeychellesSierra LeoneSingaporeSlovak RepublicSloveniaSmall statesSouth AfricaSouth AsiaSouth Asia (IDA & IBRD)South SudanSpainSri LankaSt. Kitts and NevisSt. LuciaSt. Vincent and the GrenadinesSub-Saharan Africa Sub-Saharan Africa (excluding high income)Sub-Saharan Africa (IDA & IBRD countries)SudanSurinameSwazilandSwedenSwitzerlandTajikistanTanzaniaThailandTimor-LesteTogoTongaTrinidad and TobagoTunisiaTurkeyTurkmenistanUgandaUkraineUnited Arab EmiratesUnited KingdomUnited StatesUpper middle incomeUruguayUzbekistanVanuatuVenezuela, RBVietnamWest Bank and GazaWorldYemen, Rep.ZambiaZimbabwe línea de tiempo (timeline):
En esta escala de tiempo se presenta un gráfico de 1961 y 2015 de Algeria. Los datos de 1960 están ausentes. El número de observaciones reales por fecha: 55.
Fuente (nombre):
Indicadores del desarrollo mundial
Fuente (organización):
World Bank national accounts data, and OECD National Accounts data files.
Categorías:
Economy & Growth
Se ha actualizado:
23 abr 2017 año
Los indicadores de los cambios de valor en los últimos años
Mínimo:
3.874 bn
1 ene 1967 año
Máximo:
85.13 bn
1 ene 2015 año
A la fecha de observación
Valor
Cambio absoluto
El cambio con respecto al valor anterior
1 ene 1961 año
9.437 bn
+9.437 bn
0.0%
1 ene 1962 año
9.256 bn
-181.485 millones
-1.92%
1 ene 1963 año
5.445 bn
-3.811 bn
-41.18%
1 ene 1964 año
6.17 bn
+725.941 millones
13.33%
1 ene 1965 año
4.9 bn
-1.27 bn
-20.59%
1 ene 1966 año
5.082 bn
+181.485 millones
3.7%
1 ene 1967 año
3.874 bn
-1.208 bn
-23.76%
1 ene 1968 año
5.736 bn
+1.862 bn
48.05%
1 ene 1969 año
6.943 bn
+1.208 bn
21.05%
1 ene 1970 año
8.603 bn
+1.66 bn
23.91%
1 ene 1971 año
10.817 bn
+2.214 bn
25.73%
1 ene 1972 año
10.616 bn
-201.252 millones
-1.86%
1 ene 1973 año
12.427 bn
+1.811 bn
17.06%
1 ene 1974 año
15.446 bn
+3.019 bn
24.29%
1 ene 1975 año
21.282 bn
+5.836 bn
37.79%
1 ene 1976 año
23.094 bn
+1.811 bn
8.51%
1 ene 1977 año
23.848 bn
+754.691 millones
3.27%
1 ene 1978 año
28.024 bn
+4.176 bn
17.51%
1 ene 1979 año
33.659 bn
+5.635 bn
20.11%
1 ene 1980 año
31.244 bn
-2.415 bn
-7.17%
1 ene 1981 año
31.949 bn
+704.379 millones
2.25%
1 ene 1982 año
34.497 bn
+2.549 bn
7.98%
1 ene 1983 año
35.063 bn
+565.247 millones
1.64%
1 ene 1984 año
36.572 bn
+1.509 bn
4.3%
1 ene 1985 año
37.763 bn
+1.192 bn
3.26%
1 ene 1986 año
39.639 bn
+1.876 bn
4.97%
1 ene 1987 año
34.195 bn
-5.444 bn
-13.73%
1 ene 1988 año
27.356 bn
-6.839 bn
-20.0%
1 ene 1989 año
29.541 bn
+2.185 bn
7.99%
1 ene 1990 año
31.108 bn
+1.567 bn
5.31%
1 ene 1991 año
29.718 bn
-1.39 bn
-4.47%
1 ene 1992 año
26.981 bn
-2.737 bn
-9.21%
1 ene 1993 año
24.743 bn
-2.238 bn
-8.29%
1 ene 1994 año
23.242 bn
-1.501 bn
-6.07%
1 ene 1995 año
24.266 bn
+1.024 bn
4.4%
1 ene 1996 año
24.469 bn
+203.031 millones
0.84%
1 ene 1997 año
23.586 bn
-882.787 millones
-3.61%
1 ene 1998 año
22.672 bn
-913.594 millones
-3.87%
1 ene 1999 año
27.405 bn
+4.733 bn
20.87%
1 ene 2000 año
26.841 bn
-564.31 millones
-2.06%
1 ene 2001 año
24.974 bn
-1.866 bn
-6.95%
1 ene 2002 año
28.691 bn
+3.717 bn
14.88%
1 ene 2003 año
32.438 bn
+3.747 bn
13.06%
1 ene 2004 año
35.481 bn
+3.043 bn
9.38%
1 ene 2005 año
39.468 bn
+3.987 bn
11.24%
1 ene 2006 año
42.585 bn
+3.117 bn
7.9%
1 ene 2007 año
44.543 bn
+1.958 bn
4.6%
1 ene 2008 año
47.641 bn
+3.098 bn
6.96%
1 ene 2009 año
46.602 bn
-1.04 bn
-2.18%
1 ene 2010 año
59.622 bn
+13.02 bn
27.94%
1 ene 2011 año
66.789 bn
+7.166 bn
12.02%
1 ene 2012 año
68.726 bn
+1.937 bn
2.9%
1 ene 2013 año
73.674 bn
+4.948 bn
7.2%
1 ene 2014 año
80.01 bn
+6.336 bn
8.6%
1 ene 2015 año
85.13 bn
+5.121 bn
6.4%
Ranking de los países por los datos estadísticos actuales


Comentarios: