29
/es/
es
AIzaSyAYiBZKx7MnpbEhh9jyipgxe19OcubqV5w
April 1, 2024
55555
Pre-demographic dividend
PRE
false
2
1
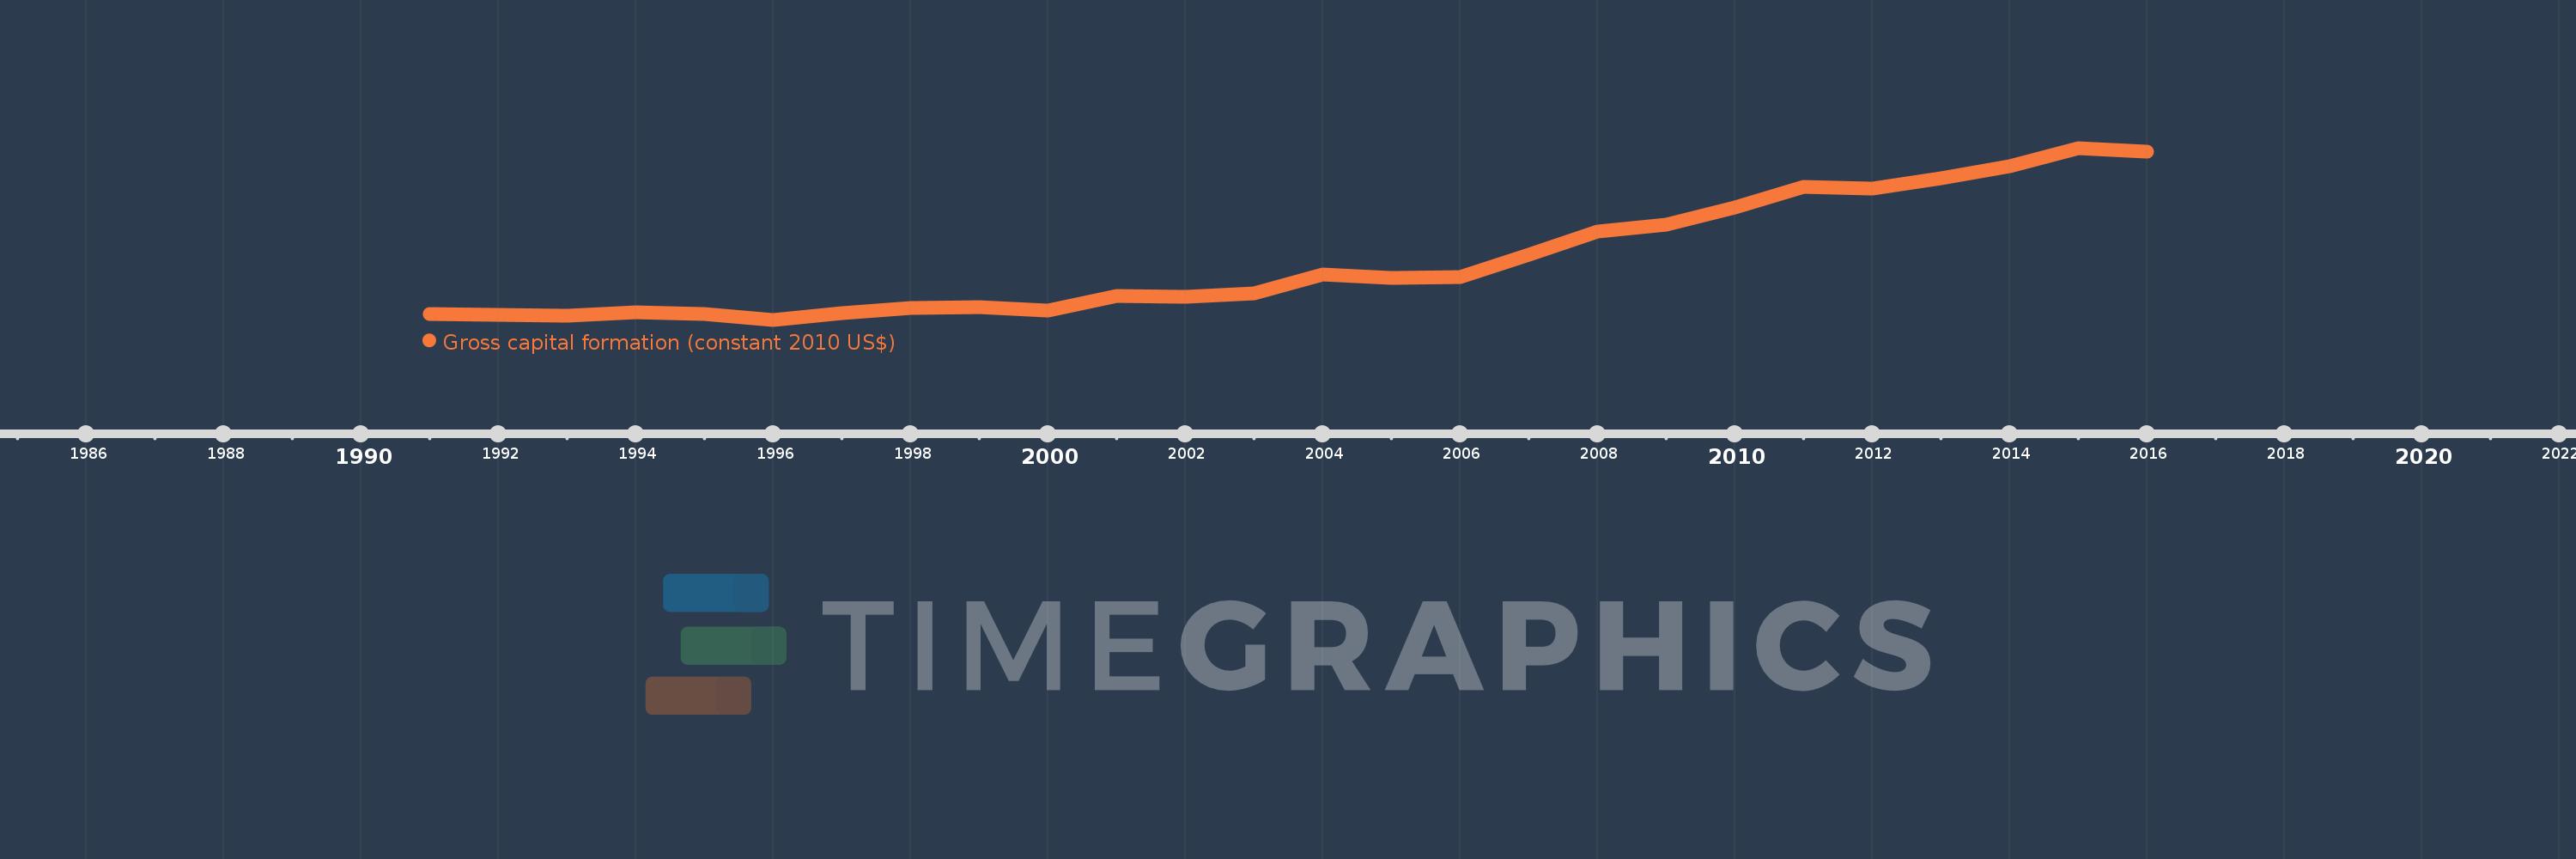
Gross capital formation (constant 2010 US$)
2016,2015,2014,2013,2012,2011,2010,2009,2008,2007,2006,2005,2004,2003,2002,2001,2000,1999,1998,1997,1996,1995,1994,1993,1992,1991
Estas estadísticas en otros países:
AfghanistanAlbaniaAlgeriaAngolaAntigua and BarbudaArab WorldArgentinaArmeniaArubaAustraliaAustriaAzerbaijanBahamas, TheBahrainBangladeshBarbadosBelarusBelgiumBelizeBeninBermudaBhutanBoliviaBosnia and HerzegovinaBotswanaBrazilBrunei DarussalamBulgariaBurkina FasoBurundiCabo VerdeCambodiaCameroonCanadaCaribbean small statesCentral African RepublicCentral Europe and the BalticsChadChileChinaColombiaComorosCongo, Dem. Rep.Congo, Rep.Cote d'IvoireCroatiaCubaCyprusCzech RepublicDenmarkDominicaDominican RepublicEarly-demographic dividendEast Asia & PacificEast Asia & Pacific (excluding high income)East Asia & Pacific (IDA & IBRD countries)EcuadorEgypt, Arab Rep.El SalvadorEquatorial GuineaEritreaEstoniaEthiopiaEuro areaEurope & Central AsiaEurope & Central Asia (excluding high income)Europe & Central Asia (IDA & IBRD countries)European UnionFaroe IslandsFinlandFragile and conflict affected situationsFranceGabonGambia, TheGeorgiaGermanyGhanaGreeceGrenadaGuatemalaGuineaGuinea-BissauGuyanaHaitiHeavily indebted poor countries (HIPC)High incomeHondurasHong Kong SAR, ChinaHungaryIBRD onlyIcelandIDA & IBRD totalIDA blendIDA onlyIDA totalIndiaIndonesiaIran, Islamic Rep.IraqIrelandIsraelItalyJamaicaJapanJordanKazakhstanKenyaKorea, Rep.KosovoKuwaitKyrgyz RepublicLao PDRLate-demographic dividendLatin America & Caribbean Latin America & Caribbean (excluding high income)Latin America & the Caribbean (IDA & IBRD countries)LatviaLeast developed countries: UN classificationLebanonLiberiaLithuaniaLow & middle incomeLow incomeLower middle incomeLuxembourgMacao SAR, ChinaMacedonia, FYRMadagascarMalawiMalaysiaMaliMaltaMauritaniaMauritiusMexicoMiddle East & North AfricaMiddle East & North Africa (excluding high income)Middle East & North Africa (IDA & IBRD countries)Middle incomeMoldovaMongoliaMontenegroMoroccoMozambiqueNamibiaNepalNetherlandsNew ZealandNicaraguaNigerNigeriaNorth AmericaNorwayOECD membersOmanOther small statesPakistanPanamaParaguayPeruPhilippinesPolandPortugalPost-demographic dividendPre-demographic dividendPuerto RicoQatarRomaniaRussian FederationRwandaSaudi ArabiaSenegalSerbiaSeychellesSierra LeoneSingaporeSlovak RepublicSloveniaSmall statesSouth AfricaSouth AsiaSouth Asia (IDA & IBRD)South SudanSpainSri LankaSt. Kitts and NevisSt. LuciaSt. Vincent and the GrenadinesSub-Saharan Africa Sub-Saharan Africa (excluding high income)Sub-Saharan Africa (IDA & IBRD countries)SudanSurinameSwazilandSwedenSwitzerlandTajikistanTanzaniaThailandTimor-LesteTogoTongaTrinidad and TobagoTunisiaTurkeyTurkmenistanUgandaUkraineUnited Arab EmiratesUnited KingdomUnited StatesUpper middle incomeUruguayUzbekistanVanuatuVenezuela, RBVietnamWest Bank and GazaWorldYemen, Rep.ZambiaZimbabwe línea de tiempo (timeline):
En esta escala de tiempo se presenta un gráfico de 1991 y 2016 de Pre-demographic dividend. Los datos de 1990 están ausentes. El número de observaciones reales por fecha: 26.
Fuente (nombre):
Indicadores del desarrollo mundial
Fuente (organización):
World Bank national accounts data, and OECD National Accounts data files.
Categorías:
Economy & Growth
Se ha actualizado:
23 abr 2017 año
Los indicadores de los cambios de valor en los últimos años
Mínimo:
44.273 bn
1 ene 1996 año
Máximo:
235.097 bn
1 ene 2015 año
A la fecha de observación
Valor
Cambio absoluto
El cambio con respecto al valor anterior
1 ene 1991 año
50.204 bn
+50.204 bn
0.0%
1 ene 1992 año
49.866 bn
-338.29 millones
-0.67%
1 ene 1993 año
48.391 bn
-1.475 bn
-2.96%
1 ene 1994 año
52.37 bn
+3.979 bn
8.22%
1 ene 1995 año
51.066 bn
-1.304 bn
-2.49%
1 ene 1996 año
44.273 bn
-6.793 bn
-13.3%
1 ene 1997 año
51.798 bn
+7.525 bn
17.0%
1 ene 1998 año
57.695 bn
+5.897 bn
11.39%
1 ene 1999 año
58.708 bn
+1.012 bn
1.75%
1 ene 2000 año
54.891 bn
-3.816 bn
-6.5%
1 ene 2001 año
70.511 bn
+15.62 bn
28.46%
1 ene 2002 año
69.916 bn
-595.1 millones
-0.84%
1 ene 2003 año
73.896 bn
+3.979 bn
5.69%
1 ene 2004 año
94.269 bn
+20.374 bn
27.57%
1 ene 2005 año
90.831 bn
-3.438 bn
-3.65%
1 ene 2006 año
91.254 bn
+422.634 millones
0.47%
1 ene 2007 año
116.301 bn
+25.047 bn
27.45%
1 ene 2008 año
142.235 bn
+25.934 bn
22.3%
1 ene 2009 año
150.06 bn
+7.825 bn
5.5%
1 ene 2010 año
168.79 bn
+18.73 bn
12.48%
1 ene 2011 año
191.691 bn
+22.901 bn
13.57%
1 ene 2012 año
190.283 bn
-1.408 bn
-0.73%
1 ene 2013 año
201.834 bn
+11.552 bn
6.07%
1 ene 2014 año
215.251 bn
+13.416 bn
6.65%
1 ene 2015 año
235.097 bn
+19.846 bn
9.22%
1 ene 2016 año
230.932 bn
-4.164 bn
-1.77%
Ranking de los países por los datos estadísticos actuales


Comentarios: