29
/es/
es
AIzaSyAYiBZKx7MnpbEhh9jyipgxe19OcubqV5w
April 1, 2024
154645
India
IND
true
2
1
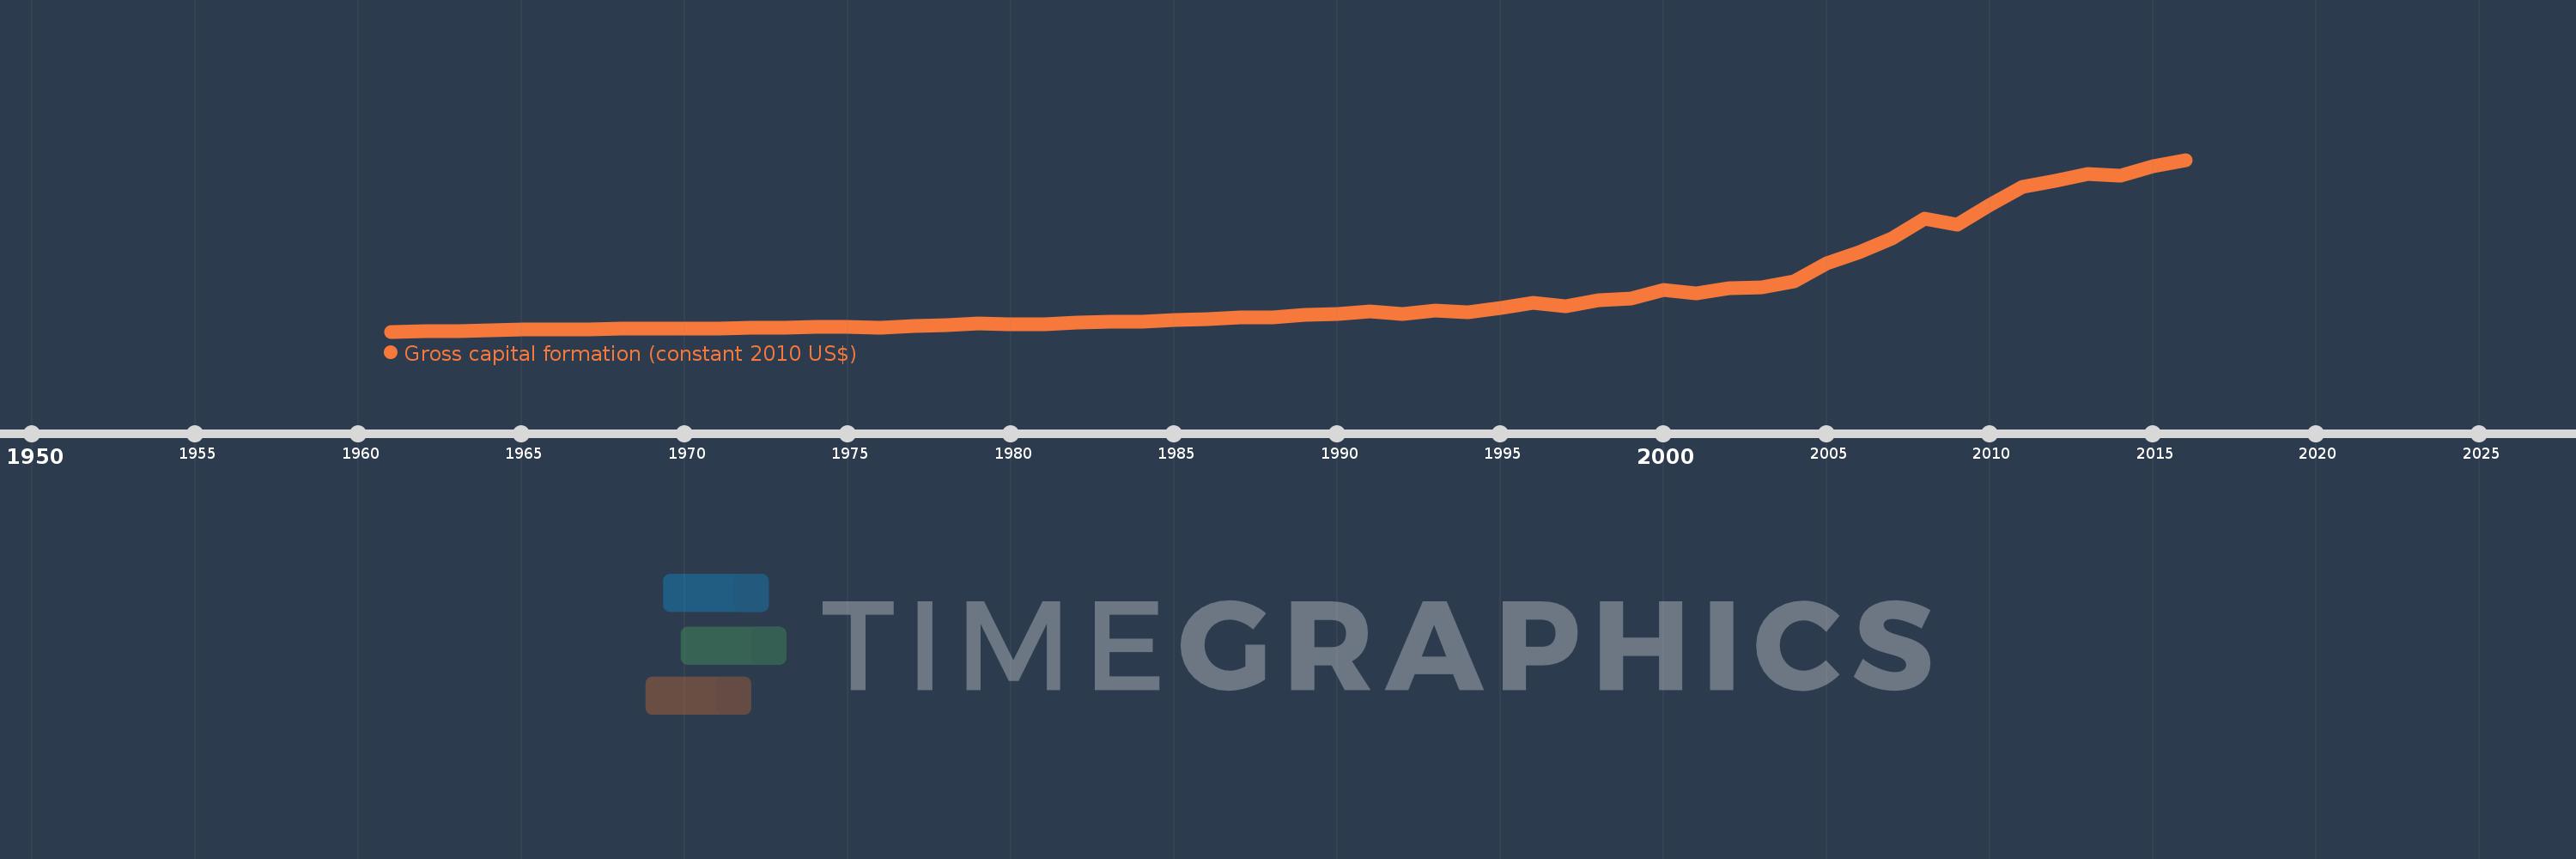
Gross capital formation (constant 2010 US$)
2016,2015,2014,2013,2012,2011,2010,2009,2008,2007,2006,2005,2004,2003,2002,2001,2000,1999,1998,1997,1996,1995,1994,1993,1992,1991,1990,1989,1988,1987,1986,1985,1984,1983,1982,1981,1980,1979,1978,1977,1976,1975,1974,1973,1972,1971,1970,1969,1968,1967,1966,1965,1964,1963,1962,1961
Estas estadísticas en otros países:
AfghanistanAlbaniaAlgeriaAngolaAntigua and BarbudaArab WorldArgentinaArmeniaArubaAustraliaAustriaAzerbaijanBahamas, TheBahrainBangladeshBarbadosBelarusBelgiumBelizeBeninBermudaBhutanBoliviaBosnia and HerzegovinaBotswanaBrazilBrunei DarussalamBulgariaBurkina FasoBurundiCabo VerdeCambodiaCameroonCanadaCaribbean small statesCentral African RepublicCentral Europe and the BalticsChadChileChinaColombiaComorosCongo, Dem. Rep.Congo, Rep.Cote d'IvoireCroatiaCubaCyprusCzech RepublicDenmarkDominicaDominican RepublicEarly-demographic dividendEast Asia & PacificEast Asia & Pacific (excluding high income)East Asia & Pacific (IDA & IBRD countries)EcuadorEgypt, Arab Rep.El SalvadorEquatorial GuineaEritreaEstoniaEthiopiaEuro areaEurope & Central AsiaEurope & Central Asia (excluding high income)Europe & Central Asia (IDA & IBRD countries)European UnionFaroe IslandsFinlandFragile and conflict affected situationsFranceGabonGambia, TheGeorgiaGermanyGhanaGreeceGrenadaGuatemalaGuineaGuinea-BissauGuyanaHaitiHeavily indebted poor countries (HIPC)High incomeHondurasHong Kong SAR, ChinaHungaryIBRD onlyIcelandIDA & IBRD totalIDA blendIDA onlyIDA totalIndiaIndonesiaIran, Islamic Rep.IraqIrelandIsraelItalyJamaicaJapanJordanKazakhstanKenyaKorea, Rep.KosovoKuwaitKyrgyz RepublicLao PDRLate-demographic dividendLatin America & Caribbean Latin America & Caribbean (excluding high income)Latin America & the Caribbean (IDA & IBRD countries)LatviaLeast developed countries: UN classificationLebanonLiberiaLithuaniaLow & middle incomeLow incomeLower middle incomeLuxembourgMacao SAR, ChinaMacedonia, FYRMadagascarMalawiMalaysiaMaliMaltaMauritaniaMauritiusMexicoMiddle East & North AfricaMiddle East & North Africa (excluding high income)Middle East & North Africa (IDA & IBRD countries)Middle incomeMoldovaMongoliaMontenegroMoroccoMozambiqueNamibiaNepalNetherlandsNew ZealandNicaraguaNigerNigeriaNorth AmericaNorwayOECD membersOmanOther small statesPakistanPanamaParaguayPeruPhilippinesPolandPortugalPost-demographic dividendPre-demographic dividendPuerto RicoQatarRomaniaRussian FederationRwandaSaudi ArabiaSenegalSerbiaSeychellesSierra LeoneSingaporeSlovak RepublicSloveniaSmall statesSouth AfricaSouth AsiaSouth Asia (IDA & IBRD)South SudanSpainSri LankaSt. Kitts and NevisSt. LuciaSt. Vincent and the GrenadinesSub-Saharan Africa Sub-Saharan Africa (excluding high income)Sub-Saharan Africa (IDA & IBRD countries)SudanSurinameSwazilandSwedenSwitzerlandTajikistanTanzaniaThailandTimor-LesteTogoTongaTrinidad and TobagoTunisiaTurkeyTurkmenistanUgandaUkraineUnited Arab EmiratesUnited KingdomUnited StatesUpper middle incomeUruguayUzbekistanVanuatuVenezuela, RBVietnamWest Bank and GazaWorldYemen, Rep.ZambiaZimbabwe línea de tiempo (timeline):
En esta escala de tiempo se presenta un gráfico de 1961 y 2016 de India. Los datos de 1960 están ausentes. El número de observaciones reales por fecha: 56.
Fuente (nombre):
Indicadores del desarrollo mundial
Fuente (organización):
World Bank national accounts data, and OECD National Accounts data files.
Categorías:
Economy & Growth
Se ha actualizado:
23 abr 2017 año
Los indicadores de los cambios de valor en los últimos años
Mínimo:
22.691 bn
1 ene 1961 año
Máximo:
793.984 bn
1 ene 2016 año
A la fecha de observación
Valor
Cambio absoluto
El cambio con respecto al valor anterior
1 ene 1961 año
22.691 bn
+22.691 bn
0.0%
1 ene 1962 año
24.38 bn
+1.689 bn
7.45%
1 ene 1963 año
26.333 bn
+1.954 bn
8.01%
1 ene 1964 año
29.392 bn
+3.059 bn
11.62%
1 ene 1965 año
32.62 bn
+3.227 bn
10.98%
1 ene 1966 año
33.159 bn
+539.542 millones
1.65%
1 ene 1967 año
33.894 bn
+735.284 millones
2.22%
1 ene 1968 año
35.156 bn
+1.262 bn
3.72%
1 ene 1969 año
35.118 bn
-38.178 millones
-0.11%
1 ene 1970 año
37.036 bn
+1.918 bn
5.46%
1 ene 1971 año
36.165 bn
-870.622 millones
-2.35%
1 ene 1972 año
40.61 bn
+4.445 bn
12.29%
1 ene 1973 año
39.895 bn
-714.697 millones
-1.76%
1 ene 1974 año
41.981 bn
+2.085 bn
5.23%
1 ene 1975 año
44.77 bn
+2.789 bn
6.64%
1 ene 1976 año
40.735 bn
-4.035 bn
-9.01%
1 ene 1977 año
46.422 bn
+5.687 bn
13.96%
1 ene 1978 año
52.884 bn
+6.462 bn
13.92%
1 ene 1979 año
58.4 bn
+5.516 bn
10.43%
1 ene 1980 año
56.228 bn
-2.172 bn
-3.72%
1 ene 1981 año
55.814 bn
-413.961 millones
-0.74%
1 ene 1982 año
65.06 bn
+9.246 bn
16.57%
1 ene 1983 año
66.936 bn
+1.876 bn
2.88%
1 ene 1984 año
67.635 bn
+699.294 millones
1.04%
1 ene 1985 año
73.05 bn
+5.415 bn
8.01%
1 ene 1986 año
79.847 bn
+6.797 bn
9.3%
1 ene 1987 año
84.745 bn
+4.898 bn
6.13%
1 ene 1988 año
84.7 bn
-44.441 millones
-0.05%
1 ene 1989 año
96.081 bn
+11.38 bn
13.44%
1 ene 1990 año
100.356 bn
+4.275 bn
4.45%
1 ene 1991 año
113.013 bn
+12.657 bn
12.61%
1 ene 1992 año
101.736 bn
-11.277 bn
-9.98%
1 ene 1993 año
117.205 bn
+15.469 bn
15.2%
1 ene 1994 año
109.279 bn
-7.926 bn
-6.76%
1 ene 1995 año
127.617 bn
+18.338 bn
16.78%
1 ene 1996 año
151.255 bn
+23.638 bn
18.52%
1 ene 1997 año
137.847 bn
-13.408 bn
-8.86%
1 ene 1998 año
163.011 bn
+25.164 bn
18.26%
1 ene 1999 año
171.434 bn
+8.423 bn
5.17%
1 ene 2000 año
209.096 bn
+37.662 bn
21.97%
1 ene 2001 año
194.942 bn
-14.153 bn
-6.77%
1 ene 2002 año
216.362 bn
+21.419 bn
10.99%
1 ene 2003 año
222.55 bn
+6.188 bn
2.86%
1 ene 2004 año
248.645 bn
+26.096 bn
11.73%
1 ene 2005 año
327.567 bn
+78.921 bn
31.74%
1 ene 2006 año
380.951 bn
+53.385 bn
16.3%
1 ene 2007 año
440.146 bn
+59.195 bn
15.54%
1 ene 2008 año
531.417 bn
+91.271 bn
20.74%
1 ene 2009 año
503.655 bn
-27.762 bn
-5.22%
1 ene 2010 año
590.551 bn
+86.895 bn
17.25%
1 ene 2011 año
673.695 bn
+83.145 bn
14.08%
1 ene 2012 año
700.24 bn
+26.544 bn
3.94%
1 ene 2013 año
729.574 bn
+29.334 bn
4.19%
1 ene 2014 año
721.544 bn
-8.03 bn
-1.1%
1 ene 2015 año
764.851 bn
+43.307 bn
6.0%
1 ene 2016 año
793.984 bn
+29.132 bn
3.81%
Ranking de los países por los datos estadísticos actuales


Comentarios: