29
/es/
es
AIzaSyAYiBZKx7MnpbEhh9jyipgxe19OcubqV5w
April 1, 2024
187836
Malaysia
MYS
true
2
1
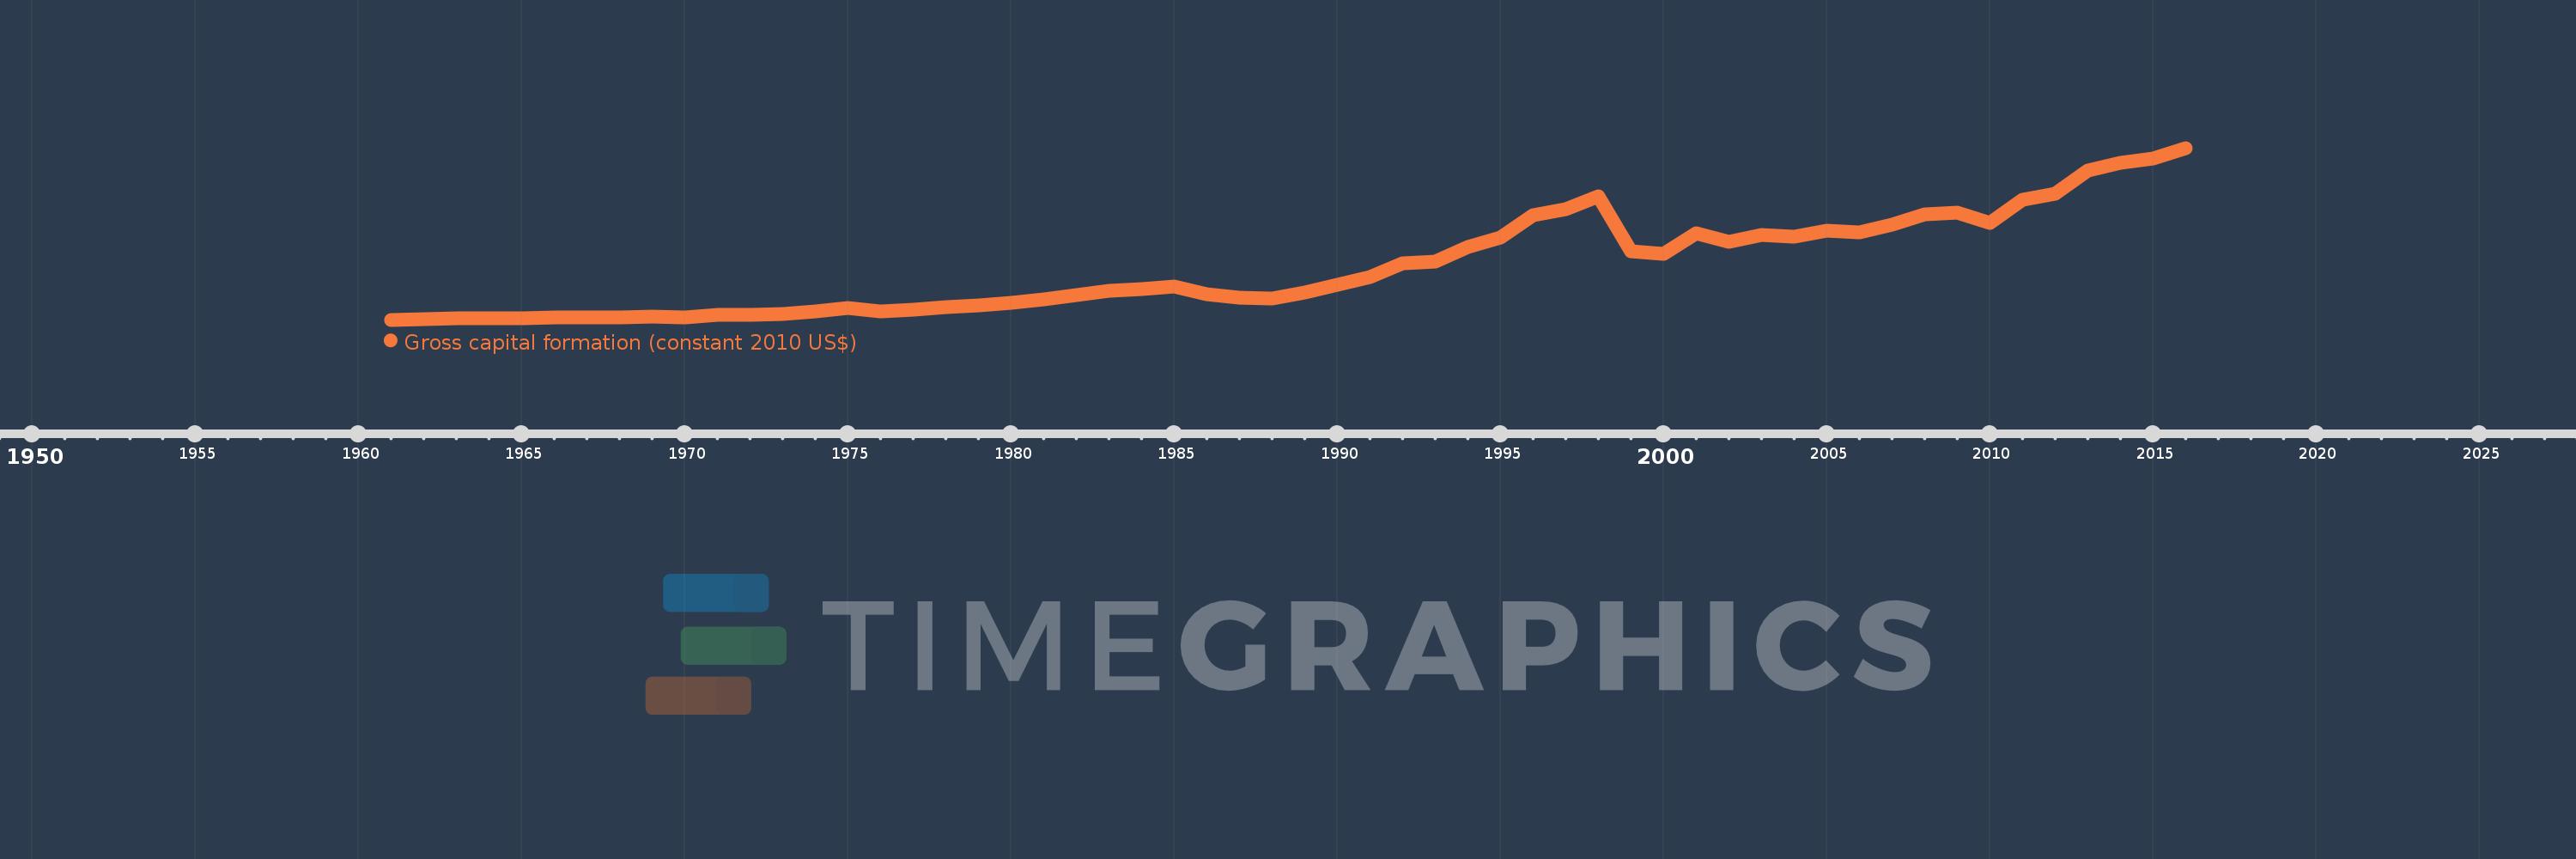
Gross capital formation (constant 2010 US$)
2016,2015,2014,2013,2012,2011,2010,2009,2008,2007,2006,2005,2004,2003,2002,2001,2000,1999,1998,1997,1996,1995,1994,1993,1992,1991,1990,1989,1988,1987,1986,1985,1984,1983,1982,1981,1980,1979,1978,1977,1976,1975,1974,1973,1972,1971,1970,1969,1968,1967,1966,1965,1964,1963,1962,1961
Estas estadísticas en otros países:
AfghanistanAlbaniaAlgeriaAngolaAntigua and BarbudaArab WorldArgentinaArmeniaArubaAustraliaAustriaAzerbaijanBahamas, TheBahrainBangladeshBarbadosBelarusBelgiumBelizeBeninBermudaBhutanBoliviaBosnia and HerzegovinaBotswanaBrazilBrunei DarussalamBulgariaBurkina FasoBurundiCabo VerdeCambodiaCameroonCanadaCaribbean small statesCentral African RepublicCentral Europe and the BalticsChadChileChinaColombiaComorosCongo, Dem. Rep.Congo, Rep.Cote d'IvoireCroatiaCubaCyprusCzech RepublicDenmarkDominicaDominican RepublicEarly-demographic dividendEast Asia & PacificEast Asia & Pacific (excluding high income)East Asia & Pacific (IDA & IBRD countries)EcuadorEgypt, Arab Rep.El SalvadorEquatorial GuineaEritreaEstoniaEthiopiaEuro areaEurope & Central AsiaEurope & Central Asia (excluding high income)Europe & Central Asia (IDA & IBRD countries)European UnionFaroe IslandsFinlandFragile and conflict affected situationsFranceGabonGambia, TheGeorgiaGermanyGhanaGreeceGrenadaGuatemalaGuineaGuinea-BissauGuyanaHaitiHeavily indebted poor countries (HIPC)High incomeHondurasHong Kong SAR, ChinaHungaryIBRD onlyIcelandIDA & IBRD totalIDA blendIDA onlyIDA totalIndiaIndonesiaIran, Islamic Rep.IraqIrelandIsraelItalyJamaicaJapanJordanKazakhstanKenyaKorea, Rep.KosovoKuwaitKyrgyz RepublicLao PDRLate-demographic dividendLatin America & Caribbean Latin America & Caribbean (excluding high income)Latin America & the Caribbean (IDA & IBRD countries)LatviaLeast developed countries: UN classificationLebanonLiberiaLithuaniaLow & middle incomeLow incomeLower middle incomeLuxembourgMacao SAR, ChinaMacedonia, FYRMadagascarMalawiMalaysiaMaliMaltaMauritaniaMauritiusMexicoMiddle East & North AfricaMiddle East & North Africa (excluding high income)Middle East & North Africa (IDA & IBRD countries)Middle incomeMoldovaMongoliaMontenegroMoroccoMozambiqueNamibiaNepalNetherlandsNew ZealandNicaraguaNigerNigeriaNorth AmericaNorwayOECD membersOmanOther small statesPakistanPanamaParaguayPeruPhilippinesPolandPortugalPost-demographic dividendPre-demographic dividendPuerto RicoQatarRomaniaRussian FederationRwandaSaudi ArabiaSenegalSerbiaSeychellesSierra LeoneSingaporeSlovak RepublicSloveniaSmall statesSouth AfricaSouth AsiaSouth Asia (IDA & IBRD)South SudanSpainSri LankaSt. Kitts and NevisSt. LuciaSt. Vincent and the GrenadinesSub-Saharan Africa Sub-Saharan Africa (excluding high income)Sub-Saharan Africa (IDA & IBRD countries)SudanSurinameSwazilandSwedenSwitzerlandTajikistanTanzaniaThailandTimor-LesteTogoTongaTrinidad and TobagoTunisiaTurkeyTurkmenistanUgandaUkraineUnited Arab EmiratesUnited KingdomUnited StatesUpper middle incomeUruguayUzbekistanVanuatuVenezuela, RBVietnamWest Bank and GazaWorldYemen, Rep.ZambiaZimbabwe línea de tiempo (timeline):
En esta escala de tiempo se presenta un gráfico de 1961 y 2016 de Malaysia. Los datos de 1960 están ausentes. El número de observaciones reales por fecha: 56.
Fuente (nombre):
Indicadores del desarrollo mundial
Fuente (organización):
World Bank national accounts data, and OECD National Accounts data files.
Categorías:
Economy & Growth
Se ha actualizado:
23 abr 2017 año
Los indicadores de los cambios de valor en los últimos años
Mínimo:
1.685 bn
1 ene 1961 año
Máximo:
84.401 bn
1 ene 2016 año
A la fecha de observación
Valor
Cambio absoluto
El cambio con respecto al valor anterior
1 ene 1961 año
1.685 bn
+1.685 bn
0.0%
1 ene 1962 año
1.846 bn
+160.588 millones
9.53%
1 ene 1963 año
2.216 bn
+370.197 millones
20.05%
1 ene 1964 año
2.344 bn
+127.625 millones
5.76%
1 ene 1965 año
2.391 bn
+47.331 millones
2.02%
1 ene 1966 año
2.65 bn
+258.631 millones
10.82%
1 ene 1967 año
2.81 bn
+160.588 millones
6.06%
1 ene 1968 año
3.007 bn
+196.931 millones
7.01%
1 ene 1969 año
3.137 bn
+129.315 millones
4.3%
1 ene 1970 año
2.949 bn
-187.634 millones
-5.98%
1 ene 1971 año
4.024 bn
+1.075 bn
36.46%
1 ene 1972 año
4.071 bn
+47.331 millones
1.18%
1 ene 1973 año
4.405 bn
+333.854 millones
8.2%
1 ene 1974 año
5.605 bn
+1.2 bn
27.24%
1 ene 1975 año
7.412 bn
+1.806 bn
32.22%
1 ene 1976 año
5.785 bn
-1.627 bn
-21.95%
1 ene 1977 año
6.455 bn
+670.243 millones
11.59%
1 ene 1978 año
7.898 bn
+1.444 bn
22.36%
1 ene 1979 año
8.54 bn
+641.506 millones
8.12%
1 ene 1980 año
9.682 bn
+1.142 bn
13.37%
1 ene 1981 año
11.505 bn
+1.823 bn
18.83%
1 ene 1982 año
13.483 bn
+1.978 bn
17.19%
1 ene 1983 año
15.421 bn
+1.938 bn
14.37%
1 ene 1984 año
16.598 bn
+1.177 bn
7.63%
1 ene 1985 año
17.507 bn
+908.588 millones
5.47%
1 ene 1986 año
14.052 bn
-3.454 bn
-19.73%
1 ene 1987 año
12.162 bn
-1.89 bn
-13.45%
1 ene 1988 año
11.846 bn
-316.104 millones
-2.6%
1 ene 1989 año
14.92 bn
+3.074 bn
25.95%
1 ene 1990 año
18.348 bn
+3.428 bn
22.98%
1 ene 1991 año
22.273 bn
+3.925 bn
21.39%
1 ene 1992 año
28.843 bn
+6.57 bn
29.5%
1 ene 1993 año
29.828 bn
+985.505 millones
3.42%
1 ene 1994 año
36.622 bn
+6.793 bn
22.78%
1 ene 1995 año
41.257 bn
+4.635 bn
12.66%
1 ene 1996 año
51.892 bn
+10.635 bn
25.78%
1 ene 1997 año
54.892 bn
+3.0 bn
5.78%
1 ene 1998 año
61.059 bn
+6.167 bn
11.24%
1 ene 1999 año
34.777 bn
-26.283 bn
-43.04%
1 ene 2000 año
33.434 bn
-1.343 bn
-3.86%
1 ene 2001 año
43.405 bn
+9.972 bn
29.82%
1 ene 2002 año
39.36 bn
-4.045 bn
-9.32%
1 ene 2003 año
42.473 bn
+3.113 bn
7.91%
1 ene 2004 año
41.831 bn
-641.859 millones
-1.51%
1 ene 2005 año
44.701 bn
+2.87 bn
6.86%
1 ene 2006 año
43.601 bn
-1.1 bn
-2.46%
1 ene 2007 año
47.34 bn
+3.74 bn
8.58%
1 ene 2008 año
52.33 bn
+4.99 bn
10.54%
1 ene 2009 año
53.308 bn
+977.495 millones
1.87%
1 ene 2010 año
48.143 bn
-5.165 bn
-9.69%
1 ene 2011 año
59.639 bn
+11.496 bn
23.88%
1 ene 2012 año
62.335 bn
+2.696 bn
4.52%
1 ene 2013 año
73.73 bn
+11.395 bn
18.28%
1 ene 2014 año
77.309 bn
+3.58 bn
4.85%
1 ene 2015 año
79.324 bn
+2.015 bn
2.61%
1 ene 2016 año
84.401 bn
+5.077 bn
6.4%
Ranking de los países por los datos estadísticos actuales


Comentarios: