29
/es/
es
AIzaSyAYiBZKx7MnpbEhh9jyipgxe19OcubqV5w
April 1, 2024
50050
Middle East & North Africa (IDA & IBRD countries)
TMN
false
2
1
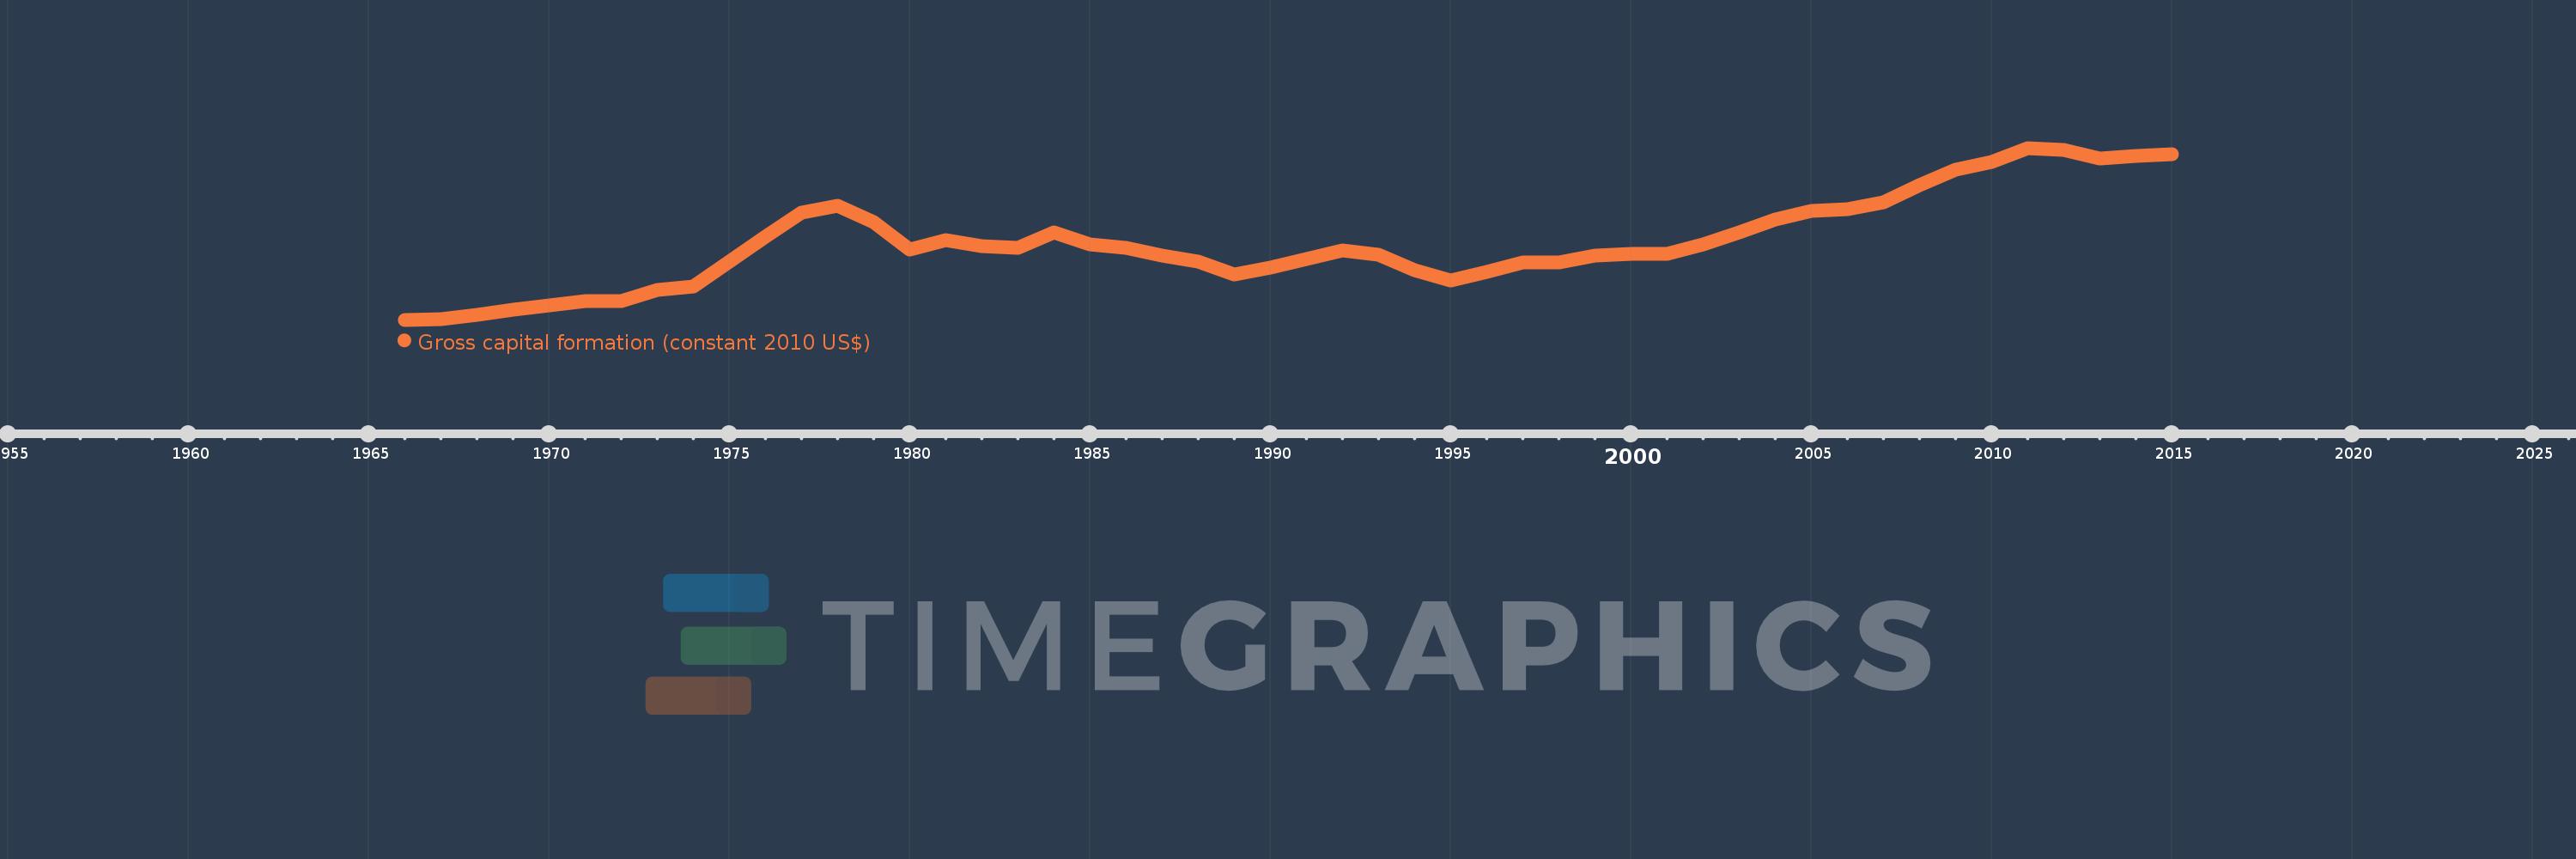
Gross capital formation (constant 2010 US$)
2015,2014,2013,2012,2011,2010,2009,2008,2007,2006,2005,2004,2003,2002,2001,2000,1999,1998,1997,1996,1995,1994,1993,1992,1991,1990,1989,1988,1987,1986,1985,1984,1983,1982,1981,1980,1979,1978,1977,1976,1975,1974,1973,1972,1971,1970,1969,1968,1967,1966
Estas estadísticas en otros países:
AfghanistanAlbaniaAlgeriaAngolaAntigua and BarbudaArab WorldArgentinaArmeniaArubaAustraliaAustriaAzerbaijanBahamas, TheBahrainBangladeshBarbadosBelarusBelgiumBelizeBeninBermudaBhutanBoliviaBosnia and HerzegovinaBotswanaBrazilBrunei DarussalamBulgariaBurkina FasoBurundiCabo VerdeCambodiaCameroonCanadaCaribbean small statesCentral African RepublicCentral Europe and the BalticsChadChileChinaColombiaComorosCongo, Dem. Rep.Congo, Rep.Cote d'IvoireCroatiaCubaCyprusCzech RepublicDenmarkDominicaDominican RepublicEarly-demographic dividendEast Asia & PacificEast Asia & Pacific (excluding high income)East Asia & Pacific (IDA & IBRD countries)EcuadorEgypt, Arab Rep.El SalvadorEquatorial GuineaEritreaEstoniaEthiopiaEuro areaEurope & Central AsiaEurope & Central Asia (excluding high income)Europe & Central Asia (IDA & IBRD countries)European UnionFaroe IslandsFinlandFragile and conflict affected situationsFranceGabonGambia, TheGeorgiaGermanyGhanaGreeceGrenadaGuatemalaGuineaGuinea-BissauGuyanaHaitiHeavily indebted poor countries (HIPC)High incomeHondurasHong Kong SAR, ChinaHungaryIBRD onlyIcelandIDA & IBRD totalIDA blendIDA onlyIDA totalIndiaIndonesiaIran, Islamic Rep.IraqIrelandIsraelItalyJamaicaJapanJordanKazakhstanKenyaKorea, Rep.KosovoKuwaitKyrgyz RepublicLao PDRLate-demographic dividendLatin America & Caribbean Latin America & Caribbean (excluding high income)Latin America & the Caribbean (IDA & IBRD countries)LatviaLeast developed countries: UN classificationLebanonLiberiaLithuaniaLow & middle incomeLow incomeLower middle incomeLuxembourgMacao SAR, ChinaMacedonia, FYRMadagascarMalawiMalaysiaMaliMaltaMauritaniaMauritiusMexicoMiddle East & North AfricaMiddle East & North Africa (excluding high income)Middle East & North Africa (IDA & IBRD countries)Middle incomeMoldovaMongoliaMontenegroMoroccoMozambiqueNamibiaNepalNetherlandsNew ZealandNicaraguaNigerNigeriaNorth AmericaNorwayOECD membersOmanOther small statesPakistanPanamaParaguayPeruPhilippinesPolandPortugalPost-demographic dividendPre-demographic dividendPuerto RicoQatarRomaniaRussian FederationRwandaSaudi ArabiaSenegalSerbiaSeychellesSierra LeoneSingaporeSlovak RepublicSloveniaSmall statesSouth AfricaSouth AsiaSouth Asia (IDA & IBRD)South SudanSpainSri LankaSt. Kitts and NevisSt. LuciaSt. Vincent and the GrenadinesSub-Saharan Africa Sub-Saharan Africa (excluding high income)Sub-Saharan Africa (IDA & IBRD countries)SudanSurinameSwazilandSwedenSwitzerlandTajikistanTanzaniaThailandTimor-LesteTogoTongaTrinidad and TobagoTunisiaTurkeyTurkmenistanUgandaUkraineUnited Arab EmiratesUnited KingdomUnited StatesUpper middle incomeUruguayUzbekistanVanuatuVenezuela, RBVietnamWest Bank and GazaWorldYemen, Rep.ZambiaZimbabwe línea de tiempo (timeline):
En esta escala de tiempo se presenta un gráfico de 1966 y 2015 de Middle East & North Africa (IDA & IBRD countries). Los datos de 1965 están ausentes. El número de observaciones reales por fecha: 50.
Fuente (nombre):
Indicadores del desarrollo mundial
Fuente (organización):
World Bank national accounts data, and OECD National Accounts data files.
Categorías:
Economy & Growth
Se ha actualizado:
23 abr 2017 año
Los indicadores de los cambios de valor en los últimos años
Mínimo:
44.628 bn
1 ene 1966 año
Máximo:
410.459 bn
1 ene 2011 año
A la fecha de observación
Valor
Cambio absoluto
El cambio con respecto al valor anterior
1 ene 1966 año
44.628 bn
+44.628 bn
0.0%
1 ene 1967 año
46.734 bn
+2.106 bn
4.72%
1 ene 1968 año
55.316 bn
+8.582 bn
18.36%
1 ene 1969 año
66.384 bn
+11.068 bn
20.01%
1 ene 1970 año
74.279 bn
+7.894 bn
11.89%
1 ene 1971 año
84.143 bn
+9.864 bn
13.28%
1 ene 1972 año
84.859 bn
+715.989 millones
0.85%
1 ene 1973 año
107.815 bn
+22.956 bn
27.05%
1 ene 1974 año
114.986 bn
+7.171 bn
6.65%
1 ene 1975 año
168.703 bn
+53.717 bn
46.72%
1 ene 1976 año
221.2 bn
+52.496 bn
31.12%
1 ene 1977 año
272.867 bn
+51.667 bn
23.36%
1 ene 1978 año
287.367 bn
+14.499 bn
5.31%
1 ene 1979 año
252.263 bn
-35.103 bn
-12.22%
1 ene 1980 año
193.576 bn
-58.687 bn
-23.26%
1 ene 1981 año
213.853 bn
+20.277 bn
10.47%
1 ene 1982 año
202.0 bn
-11.853 bn
-5.54%
1 ene 1983 año
197.679 bn
-4.321 bn
-2.14%
1 ene 1984 año
230.932 bn
+33.253 bn
16.82%
1 ene 1985 año
204.492 bn
-26.44 bn
-11.45%
1 ene 1986 año
197.493 bn
-6.998 bn
-3.42%
1 ene 1987 año
182.098 bn
-15.396 bn
-7.8%
1 ene 1988 año
167.928 bn
-14.17 bn
-7.78%
1 ene 1989 año
140.247 bn
-27.681 bn
-16.48%
1 ene 1990 año
156.029 bn
+15.782 bn
11.25%
1 ene 1991 año
174.591 bn
+18.562 bn
11.9%
1 ene 1992 año
192.464 bn
+17.873 bn
10.24%
1 ene 1993 año
183.453 bn
-9.012 bn
-4.68%
1 ene 1994 año
149.613 bn
-33.839 bn
-18.45%
1 ene 1995 año
127.643 bn
-21.97 bn
-14.68%
1 ene 1996 año
146.483 bn
+18.84 bn
14.76%
1 ene 1997 año
167.361 bn
+20.878 bn
14.25%
1 ene 1998 año
165.778 bn
-1.582 bn
-0.95%
1 ene 1999 año
181.503 bn
+15.725 bn
9.49%
1 ene 2000 año
184.174 bn
+2.671 bn
1.47%
1 ene 2001 año
185.571 bn
+1.397 bn
0.76%
1 ene 2002 año
204.72 bn
+19.15 bn
10.32%
1 ene 2003 año
230.033 bn
+25.313 bn
12.36%
1 ene 2004 año
258.225 bn
+28.192 bn
12.26%
1 ene 2005 año
277.046 bn
+18.821 bn
7.29%
1 ene 2006 año
280.626 bn
+3.58 bn
1.29%
1 ene 2007 año
293.912 bn
+13.286 bn
4.73%
1 ene 2008 año
332.044 bn
+38.132 bn
12.97%
1 ene 2009 año
363.446 bn
+31.402 bn
9.46%
1 ene 2010 año
381.276 bn
+17.83 bn
4.91%
1 ene 2011 año
410.459 bn
+29.183 bn
7.65%
1 ene 2012 año
406.452 bn
-4.006 bn
-0.98%
1 ene 2013 año
388.556 bn
-17.896 bn
-4.4%
1 ene 2014 año
393.29 bn
+4.734 bn
1.22%
1 ene 2015 año
397.601 bn
+4.312 bn
1.1%
Ranking de los países por los datos estadísticos actuales


Comentarios: