29
/es/
es
AIzaSyAYiBZKx7MnpbEhh9jyipgxe19OcubqV5w
April 1, 2024
141851
Greece
GRC
true
2
1
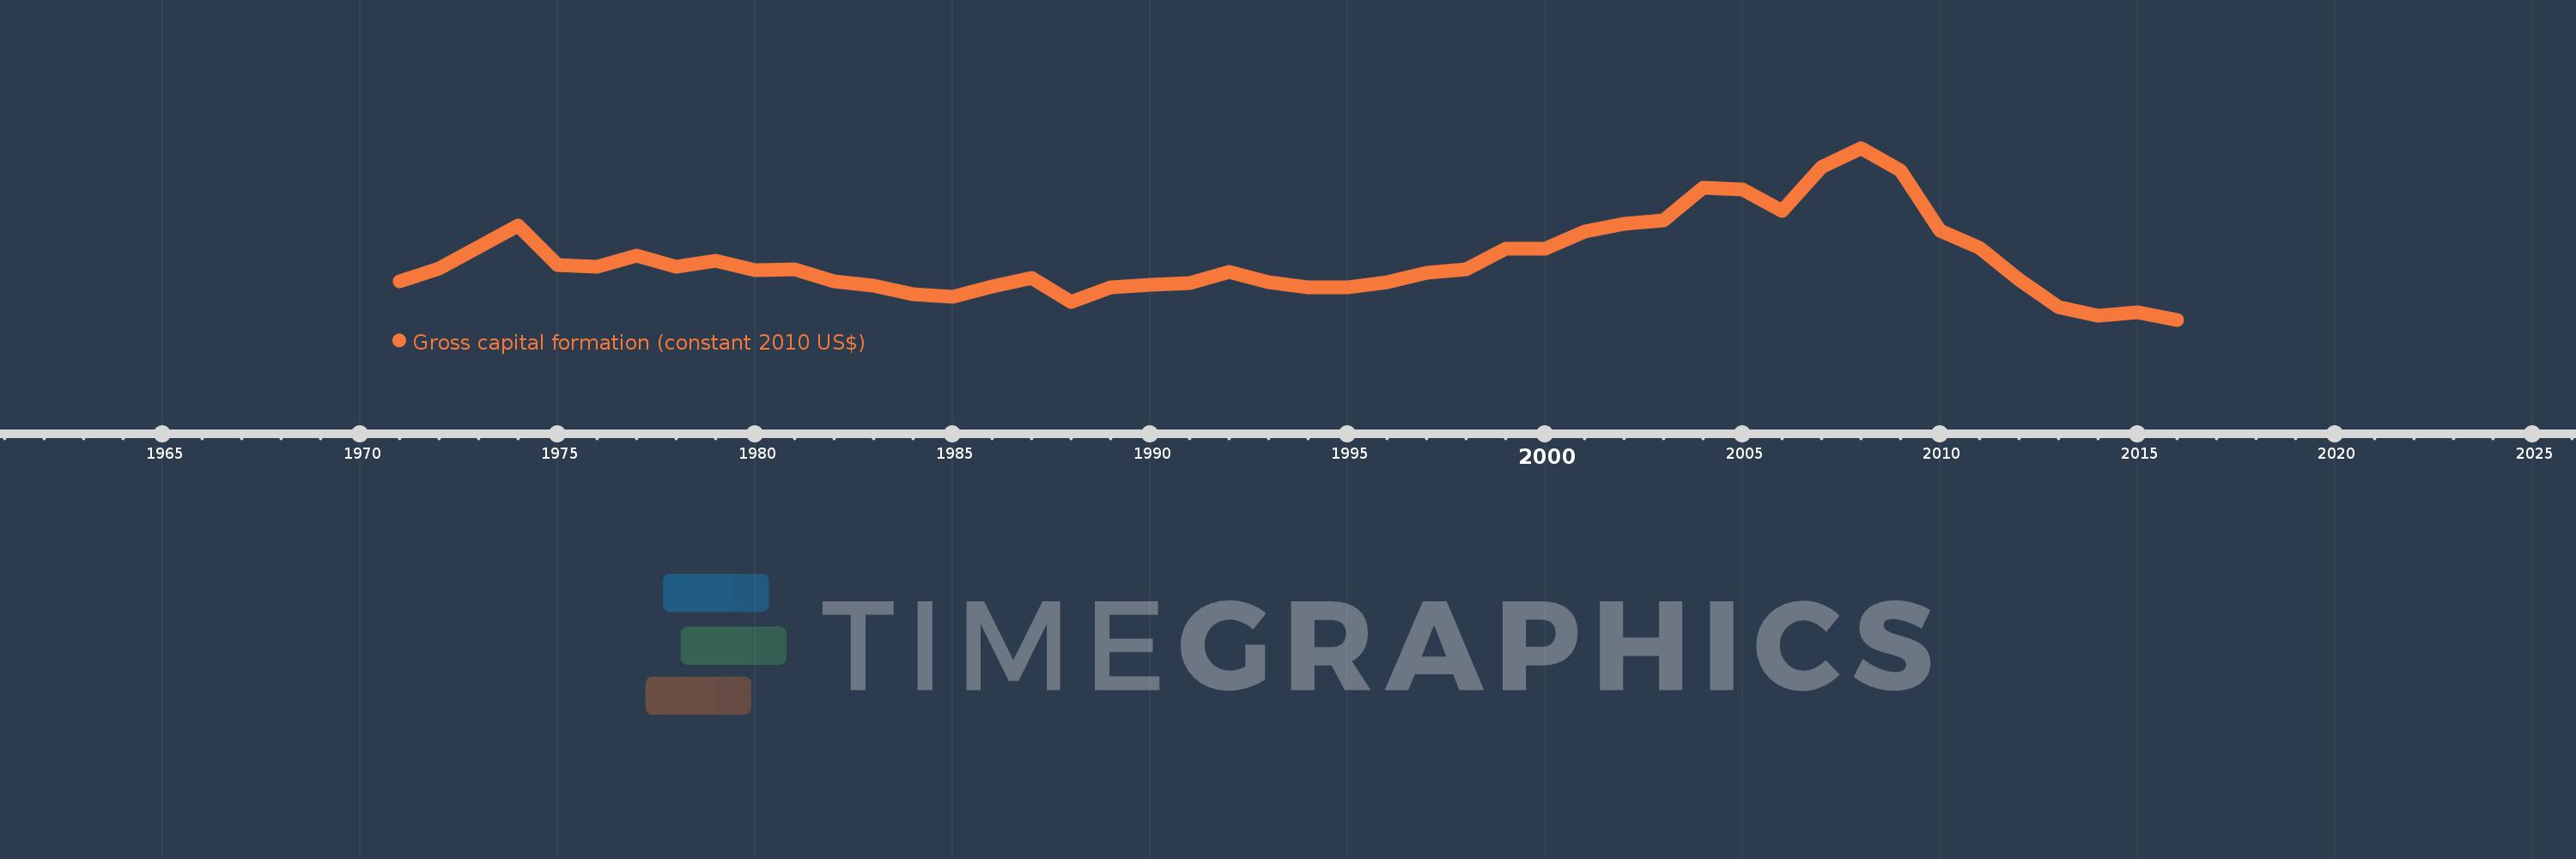
Gross capital formation (constant 2010 US$)
2016,2015,2014,2013,2012,2011,2010,2009,2008,2007,2006,2005,2004,2003,2002,2001,2000,1999,1998,1997,1996,1995,1994,1993,1992,1991,1990,1989,1988,1987,1986,1985,1984,1983,1982,1981,1980,1979,1978,1977,1976,1975,1974,1973,1972,1971
Estas estadísticas en otros países:
AfghanistanAlbaniaAlgeriaAngolaAntigua and BarbudaArab WorldArgentinaArmeniaArubaAustraliaAustriaAzerbaijanBahamas, TheBahrainBangladeshBarbadosBelarusBelgiumBelizeBeninBermudaBhutanBoliviaBosnia and HerzegovinaBotswanaBrazilBrunei DarussalamBulgariaBurkina FasoBurundiCabo VerdeCambodiaCameroonCanadaCaribbean small statesCentral African RepublicCentral Europe and the BalticsChadChileChinaColombiaComorosCongo, Dem. Rep.Congo, Rep.Cote d'IvoireCroatiaCubaCyprusCzech RepublicDenmarkDominicaDominican RepublicEarly-demographic dividendEast Asia & PacificEast Asia & Pacific (excluding high income)East Asia & Pacific (IDA & IBRD countries)EcuadorEgypt, Arab Rep.El SalvadorEquatorial GuineaEritreaEstoniaEthiopiaEuro areaEurope & Central AsiaEurope & Central Asia (excluding high income)Europe & Central Asia (IDA & IBRD countries)European UnionFaroe IslandsFinlandFragile and conflict affected situationsFranceGabonGambia, TheGeorgiaGermanyGhanaGreeceGrenadaGuatemalaGuineaGuinea-BissauGuyanaHaitiHeavily indebted poor countries (HIPC)High incomeHondurasHong Kong SAR, ChinaHungaryIBRD onlyIcelandIDA & IBRD totalIDA blendIDA onlyIDA totalIndiaIndonesiaIran, Islamic Rep.IraqIrelandIsraelItalyJamaicaJapanJordanKazakhstanKenyaKorea, Rep.KosovoKuwaitKyrgyz RepublicLao PDRLate-demographic dividendLatin America & Caribbean Latin America & Caribbean (excluding high income)Latin America & the Caribbean (IDA & IBRD countries)LatviaLeast developed countries: UN classificationLebanonLiberiaLithuaniaLow & middle incomeLow incomeLower middle incomeLuxembourgMacao SAR, ChinaMacedonia, FYRMadagascarMalawiMalaysiaMaliMaltaMauritaniaMauritiusMexicoMiddle East & North AfricaMiddle East & North Africa (excluding high income)Middle East & North Africa (IDA & IBRD countries)Middle incomeMoldovaMongoliaMontenegroMoroccoMozambiqueNamibiaNepalNetherlandsNew ZealandNicaraguaNigerNigeriaNorth AmericaNorwayOECD membersOmanOther small statesPakistanPanamaParaguayPeruPhilippinesPolandPortugalPost-demographic dividendPre-demographic dividendPuerto RicoQatarRomaniaRussian FederationRwandaSaudi ArabiaSenegalSerbiaSeychellesSierra LeoneSingaporeSlovak RepublicSloveniaSmall statesSouth AfricaSouth AsiaSouth Asia (IDA & IBRD)South SudanSpainSri LankaSt. Kitts and NevisSt. LuciaSt. Vincent and the GrenadinesSub-Saharan Africa Sub-Saharan Africa (excluding high income)Sub-Saharan Africa (IDA & IBRD countries)SudanSurinameSwazilandSwedenSwitzerlandTajikistanTanzaniaThailandTimor-LesteTogoTongaTrinidad and TobagoTunisiaTurkeyTurkmenistanUgandaUkraineUnited Arab EmiratesUnited KingdomUnited StatesUpper middle incomeUruguayUzbekistanVanuatuVenezuela, RBVietnamWest Bank and GazaWorldYemen, Rep.ZambiaZimbabwe línea de tiempo (timeline):
En esta escala de tiempo se presenta un gráfico de 1971 y 2016 de Greece. Los datos de 1970 están ausentes. El número de observaciones reales por fecha: 46.
Fuente (nombre):
Indicadores del desarrollo mundial
Fuente (organización):
World Bank national accounts data, and OECD National Accounts data files.
Categorías:
Economy & Growth
Se ha actualizado:
23 abr 2017 año
Los indicadores de los cambios de valor en los últimos años
Mínimo:
25.927 bn
1 ene 2016 año
Máximo:
86.171 bn
1 ene 2008 año
A la fecha de observación
Valor
Cambio absoluto
El cambio con respecto al valor anterior
1 ene 1971 año
39.377 bn
+39.377 bn
0.0%
1 ene 1972 año
43.812 bn
+4.436 bn
11.26%
1 ene 1973 año
51.393 bn
+7.581 bn
17.3%
1 ene 1974 año
59.071 bn
+7.677 bn
14.94%
1 ene 1975 año
45.061 bn
-14.009 bn
-23.72%
1 ene 1976 año
44.597 bn
-464.434 millones
-1.03%
1 ene 1977 año
48.416 bn
+3.819 bn
8.56%
1 ene 1978 año
44.574 bn
-3.842 bn
-7.94%
1 ene 1979 año
46.661 bn
+2.087 bn
4.68%
1 ene 1980 año
43.353 bn
-3.308 bn
-7.09%
1 ene 1981 año
43.727 bn
+374.368 millones
0.86%
1 ene 1982 año
39.384 bn
-4.343 bn
-9.93%
1 ene 1983 año
38.03 bn
-1.354 bn
-3.44%
1 ene 1984 año
34.766 bn
-3.264 bn
-8.58%
1 ene 1985 año
34.045 bn
-721.038 millones
-2.07%
1 ene 1986 año
37.558 bn
+3.514 bn
10.32%
1 ene 1987 año
40.455 bn
+2.896 bn
7.71%
1 ene 1988 año
32.098 bn
-8.356 bn
-20.66%
1 ene 1989 año
37.384 bn
+5.286 bn
16.47%
1 ene 1990 año
38.153 bn
+769.045 millones
2.06%
1 ene 1991 año
38.842 bn
+689.443 millones
1.81%
1 ene 1992 año
42.651 bn
+3.809 bn
9.81%
1 ene 1993 año
39.135 bn
-3.516 bn
-8.24%
1 ene 1994 año
37.418 bn
-1.717 bn
-4.39%
1 ene 1995 año
37.177 bn
-240.782 millones
-0.64%
1 ene 1996 año
39.207 bn
+2.031 bn
5.46%
1 ene 1997 año
42.297 bn
+3.089 bn
7.88%
1 ene 1998 año
43.505 bn
+1.209 bn
2.86%
1 ene 1999 año
50.959 bn
+7.454 bn
17.13%
1 ene 2000 año
50.723 bn
-236.241 millones
-0.46%
1 ene 2001 año
56.994 bn
+6.271 bn
12.36%
1 ene 2002 año
59.539 bn
+2.545 bn
4.47%
1 ene 2003 año
60.869 bn
+1.33 bn
2.23%
1 ene 2004 año
72.193 bn
+11.324 bn
18.6%
1 ene 2005 año
71.722 bn
-471.91 millones
-0.65%
1 ene 2006 año
64.092 bn
-7.63 bn
-10.64%
1 ene 2007 año
79.397 bn
+15.306 bn
23.88%
1 ene 2008 año
86.171 bn
+6.773 bn
8.53%
1 ene 2009 año
78.231 bn
-7.94 bn
-9.21%
1 ene 2010 año
57.2 bn
-21.031 bn
-26.88%
1 ene 2011 año
51.039 bn
-6.161 bn
-10.77%
1 ene 2012 año
39.9 bn
-11.139 bn
-21.82%
1 ene 2013 año
30.321 bn
-9.579 bn
-24.01%
1 ene 2014 año
27.314 bn
-3.007 bn
-9.92%
1 ene 2015 año
28.473 bn
+1.159 bn
4.24%
1 ene 2016 año
25.927 bn
-2.547 bn
-8.94%
Ranking de los países por los datos estadísticos actuales


Comentarios: